
Here on Equity Guru, I have been warning readers and discord members about one specific zone on the S&P 500. Yes, we have seen nice bounces on equity markets, but to me, we are not out of the danger zone just yet. In fact, this bounce is what I wanted to see as we pulled back to retest the breakdown zone.
We have tested this zone this week. Just yesterday, the S&P 500 rejected this zone. So we know that sellers are here.
Before I give you that number, let’s talk about Mr. Jamie Dimon.
Brace yourself. We really need that Edward Stark “brace yourself” meme with Jamie Dimon. Unfortunately it does not exist. Jamie Dimon is saying an economic hurricane is coming and you should “brace yourself”. JP Morgan are bracing themselves.

“You know, I said there’s storm clouds but I’m going to change it … it’s a hurricane,” Dimon said Wednesday at a financial conference in New York. While conditions seem “fine” at the moment, nobody knows if the hurricane is “a minor one or Superstorm Sandy,” he added. “You’d better brace yourself,” Dimon told the roomful of analysts and investors. “JPMorgan is bracing ourselves and we’re going to be very conservative with our balance sheet.”
Two things are worrying Dimon. The Ukraine war and its impact on commodities, including fuel and food. Readers know I write a weekly agriculture sector roundup. I do expect shortages come Fall. I also remain bullish on oil, which will see a break above recent highs of $125. Jamie Dimon is looking at oil potentially hitting $150 or $175 a barrel.
The second thing worrying Dimon is the Federal Reserve. More specifically the Fed’s quantitative tightening which began on June 1st and will see the Fed reduce their balance sheet in an effort to reduce the excess money supply.
“We’ve never had QT like this, so you’re looking at something you could be writing history books on for 50 years,” Dimon said. Several aspects of quantitative easing programs “backfired,” including negative rates, which he called a “huge mistake.” Central banks “don’t have a choice because there’s too much liquidity in the system,” Dimon said, referring to the tightening actions. “They have to remove some of the liquidity to stop the speculation, reduce home prices and stuff like that.”
Now this is a topic I have covered extensively. Months before Dimon and fund manager Bill Ackman (I even joked that Ackman might be reading my work!). The Fed has two options: either raise interest rates MUCH higher than 2.5% to tame inflation but risk bringing down the real economy and causing something to break in a world used to cheap money. The consumer gets pinched with inflation and rising interest rates. Or, the Fed pauses rate hikes because they don’t want to break the real economy, but then risk runaway inflation unless they find a way to really hammer down demand. We could se
e major inflation in the double digits if the second scenario plays out, and some even say the best case would be stagflation. A period of low economic growth but rising inflation.
Dimon is correct in warning investors to brace themselves. I have been doing the same. The Fed and other central banks will really need to raise rates to levels that would cause people’s eyes to water. It will be really bad. Assets, including the stock market will fall, and it likely causes something to break. Perhaps another financial crisis like 2008. By the way, Dr Michael Burry has been back saying this is going to be like another 2008 crash.
Now, onto that major level.

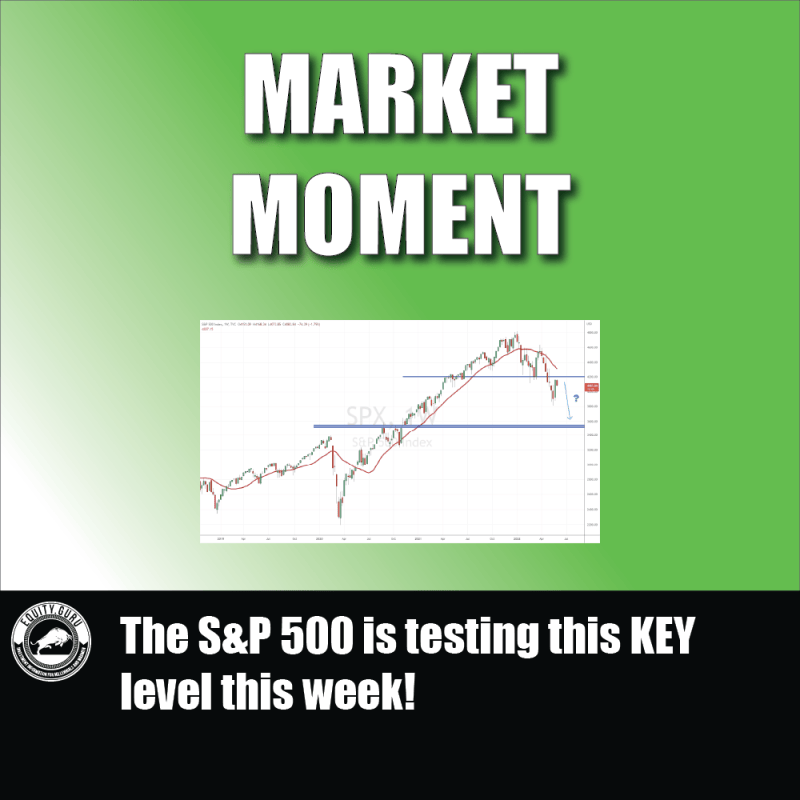
Above is the weekly chart of SPX 500. Don’t worry, I have a chart of SPY down below. The number is exactly the same, just chop off one zero at the end. 420 as opposed to 4200.
In previous posts before this stock market sell off, I warned of a reversal pattern on the S&P 500. I am talking about the head and shoulders pattern. This technical pattern has not been printed since 2007.
4200 was the neckline of this pattern. We needed to remain above 4200 to maintain the uptrend. Instead, we broke down and triggered a reversal pattern. Typical breakdown price action requires a pullback to retest what was once support as resistance before continuing the downtrend. This is exactly what we are doing now.

Above is the daily chart of 420. Note that after 5 green trading days, we hit a wall at 420. We are testing our major resistance zone. If the downtrend is to continue, this is where we should expect sellers to jump in. So far, it seems as they are.
So what do I want to see? It all depends on the weekly closes. We have to wait until the end of trading on Friday to see how this week’s candle closes. If it is a strong red candle, then there is a good chance the downtrend will continue. If the bulls manage to do the opposite, and bid prices above 420 (4200) and close above it on the weekly chart, any chance of more downside evaporates and we likely hit new record highs.
If we reject, I am looking at 360 (3600) for the next downside target. 320 (3200) might be better as it is a flip zone where price has been both support and resistance before.
This is a very important zone for the S&P 500. A few fundamental things could see a rejection here. If there is some major bad news due to geopolitics or just domestically (monkey pox), we can see fear return. This would cause a major sell off. And then of course the Federal Reserve. If the markets believe the Fed is going to raise rates much higher than 2.5%, I believe markets would have to price that in. Let’s not also forget about quantitative tightening. Mark this major resistance level on your charts!