
Exactly one week ago, I wrote about the yield curve and what I was seeing. Lots of inversions on the long end. Inversions in the 20 and the 30, 7 and the 10, and the 3 and 5. A lot of action has taken place in the bond markets, and it is time to start paying attention to the largest markets in the world.
I spoke about watching the cross between the 2 and the 10. Historically, this is the signal of an economic slowdown or a recession and triggers an inverted yield curve.
As a refresher, here is Investopedia’s definition:
A yield curve is a line that plots yields (interest rates) of bonds having equal credit quality but differing maturity dates. The slope of the yield curve gives an idea of future interest rate changes and economic activity. There are three main shapes of yield curve shapes: normal (upward sloping curve), inverted (downward sloping curve), and flat.
A yield curve is used as a benchmark for other debt in the market, such as mortgage rates or bank lending rates, and it is used to predict changes in economic output and growth. The most frequently reported yield curve compares the three-month, two-year, five-year, 10-year, and 30-year U.S. Treasury debt. Yield curve rates are usually available at the Treasury’s interest rate websites by 6:00 p.m. ET each trading day.
A normal yield curve is one in which longer maturity bonds have a higher yield compared to shorter-term bonds due to the risks associated with time. An inverted yield curve is one in which the shorter-term yields are higher than the longer-term yields, which can be a sign of an upcoming recession. In a flat or humped yield curve, the shorter- and longer-term yields are very close to each other, which is also a predictor of an economic transition.
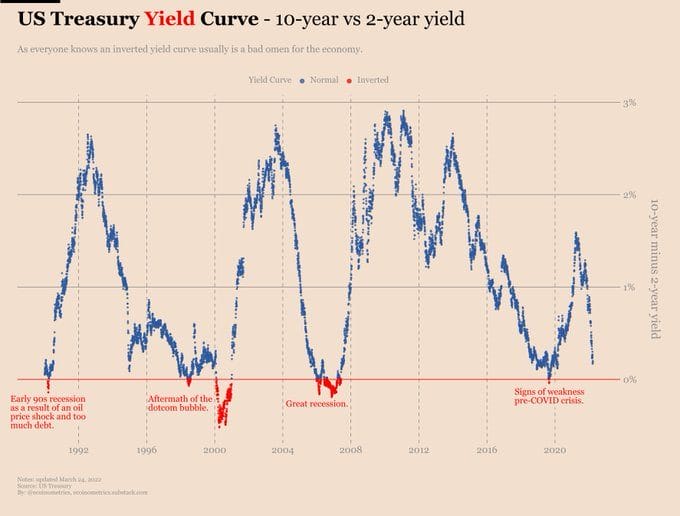
An inverted yield curve has predicted eight of the last 10 and 10 of the last 13 recessions.

Above is a chart I found last week. It shows the 10 year yield minus the 2 year yield. When we cross the horizontal red line at 0, we enter an inverted yield curve. Notice the last few times we have crossed over, we either get some recession or a major event. By the way, because I found this chart last week, it doesn’t show the fact that yesterday, we did invert. The first time since 2019 pre-Covid.
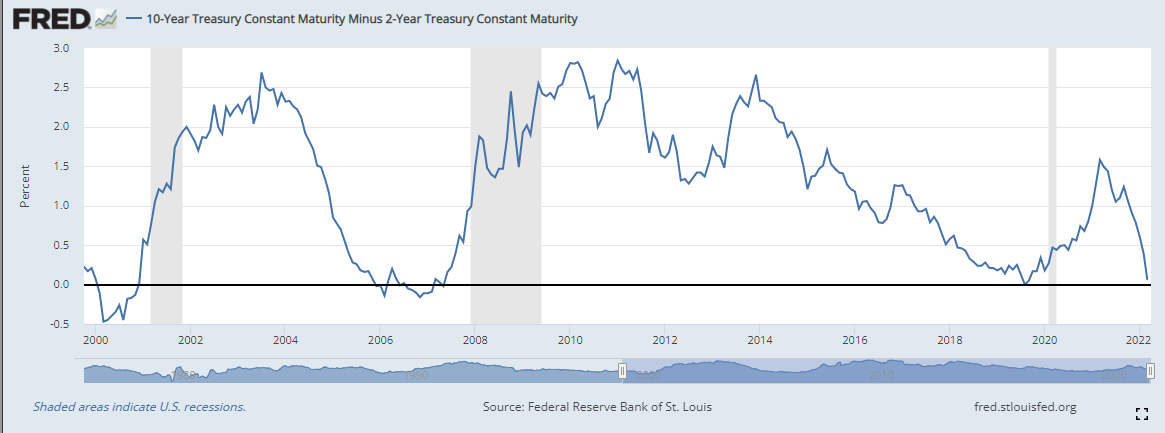
Above is an updated chart from the Federal Reserve. We inverted for some time yesterday, and now the spread between the 2 and the 10 is less than 5 basis points at time of writing.
I have had a lot of people ask me why the yield curve inversion is bad. Instead of saying that banks borrow short term paper and lend long term paper, let me simplify it.
Say I came to you and wanted to borrow money. You gave me two options. To borrow for the short term (2 years) or borrow for the long term (10 years). How much interest would you charge me? Naturally, you would charge me a lot less interest for 2 years than 10 years. As a creditor, you want more profit for being parted with your cash for a longer period of time.
If you charge me the same amount of interest, or more interest for 2 years rather than 10 years, it means you believe there is more risk in the short term versus the long term. As a creditor, you believe something is wrong, or something is going wrong in the world economy.
What could it be? Who knows. But it is more likely due to the fact that the Fed hiking interest rates 6-7 times could cause a slow down because of the amount of debt out there. The big question is how many rate hikes will we get before the Fed will need to reverse policy and cut rates and become accommodative to support a weak economy/recession.
Now getting a yield curve inversion doesn’t mean we get a recession the day after or a week from now, or even a month from now. Usually, we get that recession or slowdown 1 year or two years after the inversion. Believe me, a lot of people have already started the 365 days recession countdown clock.
A lot of people are thinking that the stock markets are performing well because the geopolitical risk is dying down with potential peace talks. Perhaps. However, part of me says that many market participants could be frontrunning the Fed hiking less than anticipated. The cheap money continues which poses a problem for inflation.
Mind you, the Fed hiking 6-7 times wouldn’t do anything to bring down inflation, they would need to raise rates above the level of inflation which recently came out at 7.9%. But this takes us back to the Fed’s toolkit and if the Fed is actually stuck. Do they raise rates and cause a recession…or do they let inflation run out of control. Fun times ahead.