
With markets expecting more rate hikes from the Federal Reserve, a lot of contrarians have been asking one simple question. “How many rate hikes are possible in this cycle before the Fed breaks the economy”?
Put it this way. There is a lot of debt in the system. Both government and consumer debt. Recent defense spending complicates things because governments (particularly the US) will have to either print more money, thereby increasing inflationary pressures, or raise taxes. The latter would hurt the economy especially as consumers are being hit by rising inflation and seeing the price of credit and borrowing increasing.
The consumer is being pinched on both sides here. It isn’t just me saying this, but many top analysts on Wall Street do think that the US consumer may begin to spend less. That they will begin to save.
This cycle of rate hikes might be the shortest ever. The Fed is going to cause a recession by hiking, and sometime this year or the next, the Fed will have to reverse policy and CUT rates to deal with a recession. Usually 2% needs to be cut to combat an economic slowdown. A bit problematic when you are sitting at less than 1%. The other option would be to follow Japan and Europe by going negative.

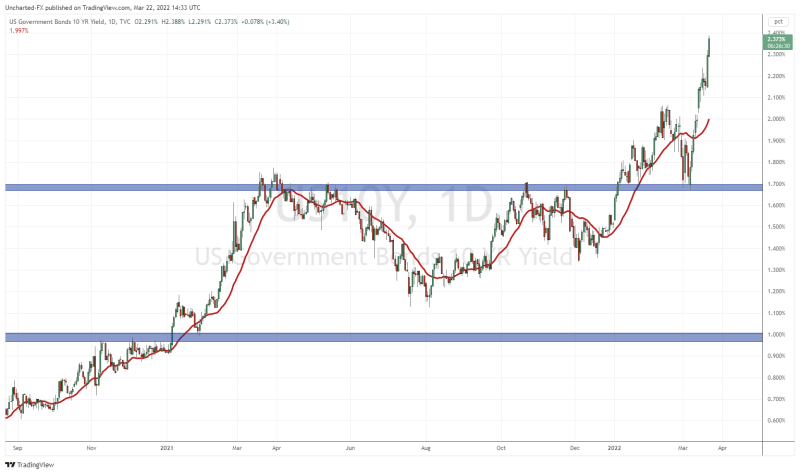
As eyes are on the stock markets, which by the way I believe will be making new record highs, the debt market continues to create fireworks. What a move in the 10 year, now yielding over 2.35%!
Readers will recall me mentioning the 1.70% support zone. It held on the retest and we did now confirm another higher low. Zooming out, I do not see resistance until 2.60%! Markets are expecting rates to rise.
For us precious metal investors, let’s be a bit cautious here. Rising yields will hit gold. Since gold yields nothing, it is great to hold when rates are low for safety. But the real safety play has been government bonds.
So what do rising yields mean? It means a falling demand for treasury bonds. Remember, there is an inverse relationship between bonds and yields. When bond prices drop or sell off, it means yields are rising. It makes sense. If you know rates are going up, then the bonds you are buying now won’t be worth as much as bonds yielding much more later on. When bonds sell off, it means we are in a risk on environment. Money is running into higher risk higher reward investments like stocks.
What has me worried is a flattening to inverting yield curve. What the heck am I talking about? Here is Investopedia’s definition:
A yield curve is a line that plots yields (interest rates) of bonds having equal credit quality but differing maturity dates. The slope of the yield curve gives an idea of future interest rate changes and economic activity. There are three main shapes of yield curve shapes: normal (upward sloping curve), inverted (downward sloping curve), and flat.
A yield curve is used as a benchmark for other debt in the market, such as mortgage rates or bank lending rates, and it is used to predict changes in economic output and growth. The most frequently reported yield curve compares the three-month, two-year, five-year, 10-year, and 30-year U.S. Treasury debt. Yield curve rates are usually available at the Treasury’s interest rate websites by 6:00 p.m. ET each trading day.
A normal yield curve is one in which longer maturity bonds have a higher yield compared to shorter-term bonds due to the risks associated with time. An inverted yield curve is one in which the shorter-term yields are higher than the longer-term yields, which can be a sign of an upcoming recession. In a flat or humped yield curve, the shorter- and longer-term yields are very close to each other, which is also a predictor of an economic transition.
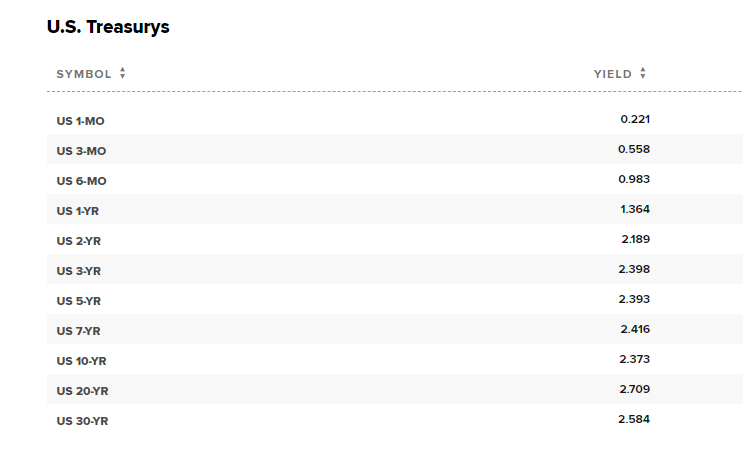
Currently, the short term is rising, and then we begin to flatten out at the end of the curve. Actually, there are some humps. Note how part of the long end is already inverting. The 20 is higher than the 30, the 7 is higher than the 10, and just recently, the 3 is beginning to go higher than the 5.
When it comes to recession watch, many analysts watch for an inversion of the 2 and the 10. We are not there just yet, so we do not have an inverted yield curve. Although, the spread between the 2 and the 10 has narrowed by about 60 basis points since the start of the year. Now, we are only 19 basis points between the 2 and the 10. Going back to the Investopedia definition above, we can say we have a flat yield curve meaning economic uncertainty.
Perfect. More uncertainty is just what we need. This is where forecasting the real economy and consumers come in handy. Personally, I still think the consumer will pullback on purchases as interest rates rise and inflation continues to spike. Therefore, I am looking for an inverted yield curve sometime in the future.
The yield curve is looking ominous, and you should pay attention to the 2 and the 10 since an inverted yield curve has predicted eight of the last 10 and 10 of the last 13 recessions.