Solar Stocks had quite the move late December and into the beginning of 2021. The catalyst was the incoming Biden administration and his green/clean infrastructure bill. We are talking big gains, even some 1000% moves in the smaller Solar stocks. You will see what I am talking about when we take a look at the charts.
Green infrastructure is coming. The question is does Solar and wind become the pre-eminent choice, or is there an in between? I am of course talking about nuclear energy, which is the cleanest CO2 free energy we have now, and Bill Gates says is the best energy source to fight climate change. Just a few days ago, Mr. Gates founded TerraPower chose a Wyoming Coal town for his new experimental reactor. This I think is the big threat against solar panels. I know some cringe when they hear about nuclear power, but MODERN and new nuclear reactors are some of the most safe buildings ever designed by mankind. The Fukushima reactor was built sometime in the 80’s.
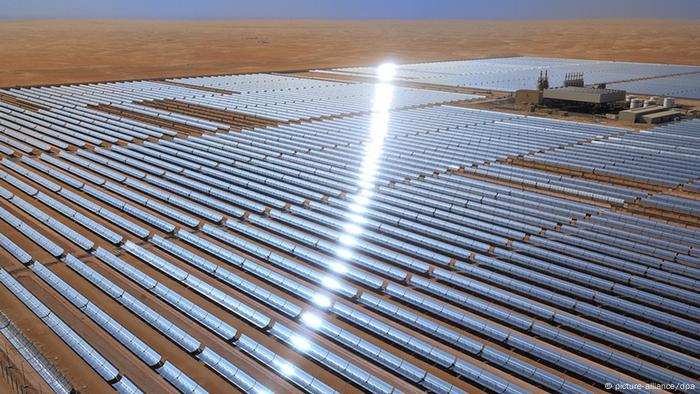
The thing about Solar is base load power. I remember reading stories about how there were blackouts in some parts of California trying Solar because they forgot the sun goes down in the evening. Solar panels couldn’t deal with base load power at night. I’m intrigued by Solar because of Agriculture. Shameless plug for my Agriculture Sector roundups here on Equity Guru released every Friday! Go check them out! I digress, but the best place for Solar panels and Wind turbines are areas that receive a lot of sun and wind. No big surprise. The thing is, these areas also tend to be the best agricultural land, which creates this competition between energy and food. Of course some nations can compromise, others may need to go to indoor farming or vertical integrated to make up for solar farms. And then you have places like Saudi Arabia, who have vast deserts and constant sun. Makes sense that the Saudis are planning to build the world’s largest solar farm.
If you believe baseload power in panels will increase, then there is another way to play Solar. Commodities. To increase baseload power means more Silver, Copper and various other metals. I prefer this because commodities can get a nice bump on the inflation story let alone the supply and demand issue when factoring industrial purposes.

As we look at some charts, I first want to highlight the Solar ETF, RAYS. My technical readers know that this close below support isn’t too great. We would expect a drop to $24.50, or at least need to close back above $26.30 to turn bullish. Things get complicated because I am writing this a day after the everything sell off on Global Stock Markets. Fear of a new Covid variant out of South Africa. The complication arises because last week was Thanksgiving in the US. Friday was a shortened trading day, so there was not much liquidity in markets. Things will be more clear come Monday when normal liquidity returns. We shall find out if people are actually fearful, or this is a great buy the dip moment.
Here are the top holdings for RAYS:
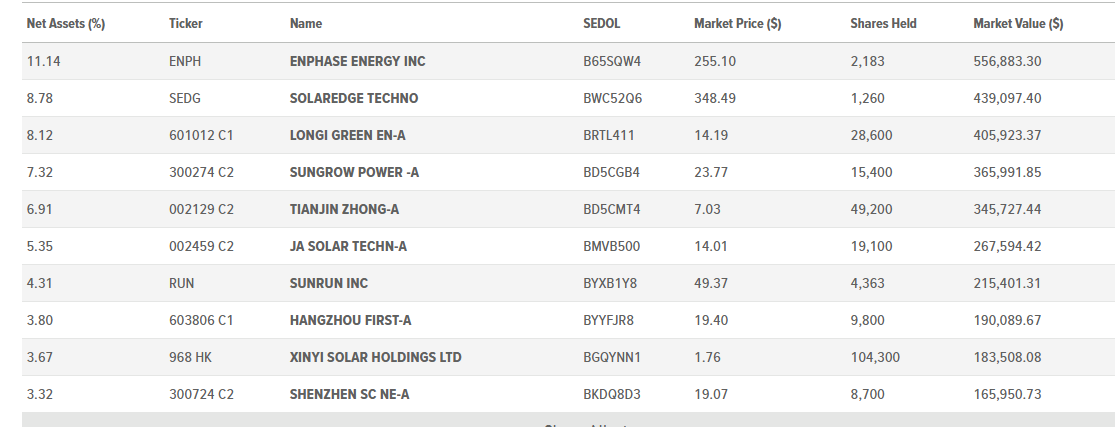
Let’s begin looking at two smaller Solar Companies before looking at two big boys, just because the latter provides an interesting opportunity if Stock Markets are going down the fear path. Note all the late 2020 Winter and early 2021 pops on all these charts.
Solar Alliance Energy (SOLR.V)
Solar Alliance is an energy solutions provider focused on residential, commercial and industrial solar installations. The Company operates in Tennessee, Kentucky, North/South Carolina and Illinois and has an expanding pipeline of solar projects. The stock is traded on the TSX Venture exchange under the ticker SOLR.V.
Q3 earnings were released on the 26th. Here are some highlights:
- Revenue for the three months ended September 30, 2021, was $252,352, compared to $530,385 in the comparable period in 2020. Revenue for the nine months ended September 30, 2021, was $2,255,460, compared to $2,517,610 in the comparable period in 2020.
- Q3 represents an inflection point for Solar Alliance as the Company invested in new sales channels to improve the long-term sales pipeline of larger solar projects. This focus resulted in the signing of two larger projects after the end of Q3 and the addition of several other large projects to our sales pipeline. The contracts signed subsequent to the end of Q3 will positively impact revenues in Q4 and moving forward.
- Cash and cash equivalents of $3,165,889 provide a strong balance sheet to continue pursuing larger project sales opportunities and provide a stable platform for growth.
- Solar Alliance signed a contract for a 526-kW solar system in Tennessee. Solar Alliance will design, engineer and install the project, which is targeted for completion by the end of 2021.
- The Company signed a contract to build a 500-kW solar system in Kentucky. The contract includes an option for the customer to select Solar Alliance to build an additional 500-kW system at the same location, for a potential total project size of 1 MW.
- The Company completed the acquisition of a 298-kW project in New York State from Abundant Solar Power Inc. The project acquisition, first announced on May 26, 2021, represents the first project Solar Alliance will own and operate under a 30-year power purchase agreement. Construction will commence in early 2022.

Some may look at the above chart and say ‘ugh..that’s ugly’. I look at it and say ‘hmmm, a possible opportunity. Only because it meets the criteria for technical charts that I keep on my watchlist. I like stocks that are beat up and have a long downtrend. I look for basing or ranges. Just like the one we are seeing on Solar Alliance between $0.22 and $0.16. We are at the bottom of that support range right now. Monday’s price action will be crucial. If we see a nice green daily candle close with substantial above average volume, then that could be an early entry opportunity. Me being a bit more patient with my breakouts prefer a daily close above $0.22 for an entry. Only because that breakout would confirm a new uptrend.
UGE International (UGE.V)
Another TSX Venture listed company. UGE International Ltd is a solar and renewable energy solutions company that provides commercial and community solar energy solutions to commercial and industrial clients in Canada, the United States, and the Philippines. It develops, builds, owns, operates, deploys, and finances solar projects, as well as offers engineering and consulting services.
UGE also reported Q3 earnings last week. Here are the highlights:
- Generated energy production revenue growth of 37% from the prior quarter as a result of the Company’s fourth US project having a full quarter of operation. Revenue was $64,560 from 295,155 kWh of energy in the quarter, compared with $47,096 from 234,680 kWh of energy in Q2 2021 (and $16,001 from 58,799 kWh in Q3 2020).
- Generated revenue from client-financed agreements, projects in the Philippines, and engineering services of $465,325 in the quarter, compared to $527,778 in Q2 2021 and $115,811 in Q3 2020.
- Realized a net loss of $1.33 million or $0.04 per share in the quarter, compared to net income of $0.35 million in Q3 2020. The comparable quarter experienced a gain from settlement of debt on the Canadian subsidiary that UGE exited. Losses are expected as corporate structure scales ahead of the associated scale of recurring revenue.
- Ended the quarter with $1.3 million in cash and a $1.8 million working capital deficit. Cash used in operating activities was $0.7 million. Subsequent to quarter end, the holder of a CAD$0.7 million convertible note converted the note into shares of the Company and a CAD$2.0M financing was closed.

The stock had a major sell off on Friday following the majority of stocks on one of the worst days in recent times. Once again, Monday becomes the make or break day. We have pulled back to a huge support zone. Note the last time we tested this $1.70 zone, we had a huge pop on November 2nd 2021. That’s the kind of green candle I want to see. Green with good volume indicating bulls are stepping in. Once we take out recent highs of $2.02, this heads to $2.50.
Boralex (BLX.TO)
Now to the bigger companies. I want you to take note of how the charts look.
Boralex Inc engages in the development, construction, and operation of renewable energy power facilities primarily in Canada, France, the United Kingdom, and the United States. As of December 31, 2020, the company had interests in 88 wind power stations with an installed capacity of 2,002 megawatts (MW); 16 hydroelectric power stations with a capacity of 181 MW; two thermal power stations with an installed capacity of 47 MW; and 10 solar power stations with an installed capacity of 225 MW. It also operates two hydroelectric power stations on behalf of R.S.P. Ãnergie Inc.
They have a hydroelectric, thermal and energy storage element too. Great for diversifying if you think the world starts to head towards say nuclear or other sources. Hydroelectricity is pretty solid, but maybe I am biased because I live in BC.

That hydroelectric portion adds an element of utility. Utility stocks are seen as the safe plays especially when stock markets are dropping. People will still be using electricity and power. These types of stocks do not necessarily make huge volatile moves. They are supposed to be stable. The most important thing? The dividend. You buy shares, and you hold. Keep adding monthly for those dividends. I would argue there is an element of a growth stock too given the rise of green energy infrastructure projects to combat climate change. The best of both worlds.
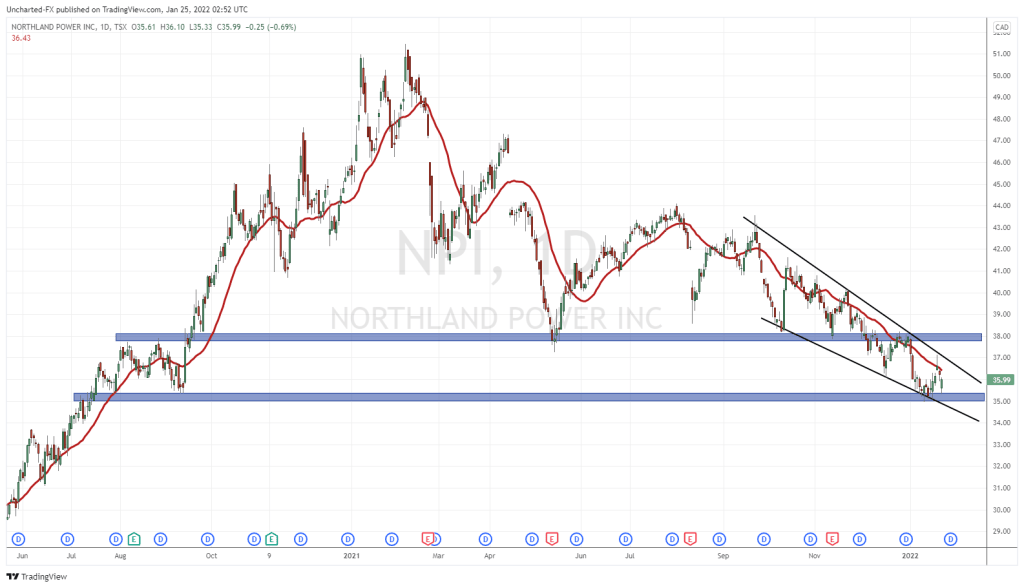
The stock has been ranging between $34 and $40 since May of this year. Typical range play. Just await the breakout. But then again, a utility company like this isn’t one you necessarily want to trade. I believe it is prudent to have a utility play in your long term portfolio. I have one. And we are going to talk about that company now.
Innergex Renewables (INE.TO)
Innergex Renewable Energy Inc. operates as an independent renewable power producer in Canada, the United States, France, and Chile. It acquires, owns, develops, and operates hydroelectric facilities, and wind and solar farms, as well as energy storage facilities. The company operates through three segments: Hydroelectric Generation, Wind Power Generation, and Solar Power Generation. As of February 25, 2021, it owned and operated 75 facilities with a net installed capacity of 2,742 megawatts, which included 37 hydroelectric facilities, 32 wind farms, and six solar farms; and had interests in 10 projects under development, as well as prospective projects at various stages of development.
Disclaimer: I own the stock. It is my utility play. I like the constant dividends, and from someone coming from the mining sector, I was surprised a few years ago. This renewable energy company was paying out dividends, so they were profitable (I thought these companies wouldn’t become profitable for years), and they pulled a large acquisition. Back in 2018, Innergex bought out Alterra power corp for $1.1 Billion. A very big deal back then, which indicated to me that moves were being made in the renewable energy space.

The chart of Innergex is acting just like a utility. The bottom of the range is being tested, and I hope it holds. Same playbook: await the breakout or add if we see buyers step in here at support. I’ll be watching closely for an add.