We have all met that Uranium bull in our investing circles. In my circle, it’s me. I have always been bullish on Uranium as it is the cleanest green CO2 free energy we have. Media likes to talk up the reactors and how they are dangerous but here is the thing: Fukushima and other reactor issues had to do with OLD reactors. New modern reactors are safe. Marin Katusa says this at the Vancouver Resource Investment Conference almost yearly on Uranium, but what the media doesn’t tell you is that during the earthquake in Fukushima, people ran to the NEW nuclear reactor for SAFETY. We are talking about solid structures which even have rising walls to protect from surging water levels.
Being a Uranium bull has been sort of tough. I mean the looks you get from most people, as many don’t understand the yellowcake itself thanks to the media. But secondly, price didn’t really do much for years. Even with favorable demand and supply mechanics. We rose slowly, but nothing exciting.
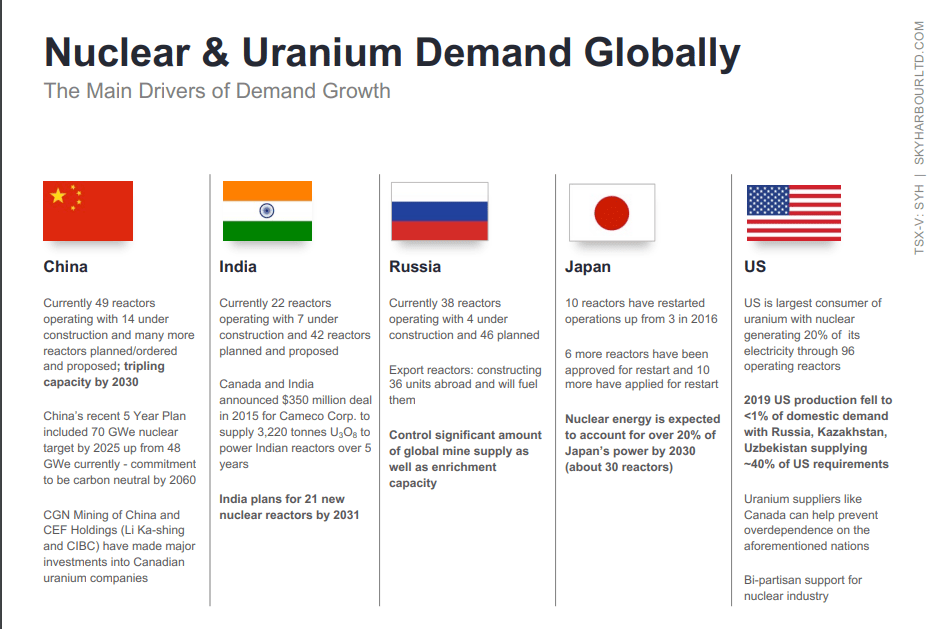
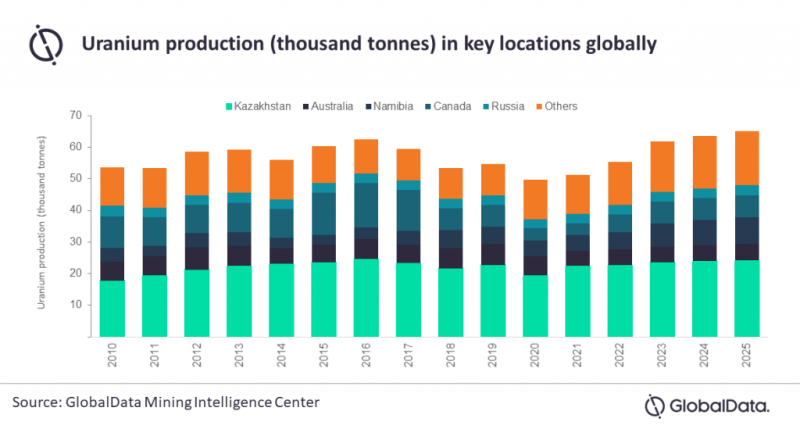
Well Uranium bulls rejoice! After the pandemic, which has halted construction of new plants, closed mines in Canada, and seen a declining secondary supply, it seems we are finally taking a turn. A recovery backed by GlobalData saying Uranium Production is expected to grow at 6.2% to 65.2kt by 2025.
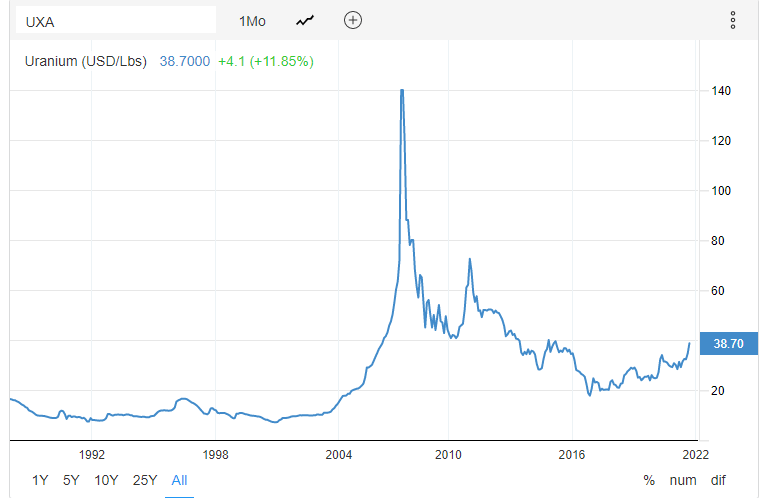
Not only that, but Uranium prices are in take off mode! Spot prices hitting above $35 per pound for the first time in 6 years! Take a look at this monthly chart below of Uranium going back to 1988. First of all, we can draw a nice uptrend line from the bottom in 2016 to the current price. But secondly, I want to point out the $40 dollar zone. A big resistance zone going back to 2010 and 2014. If we can climb above $40 in the upcoming weeks and months…it’s go time. $60 Uranium becomes the next target.
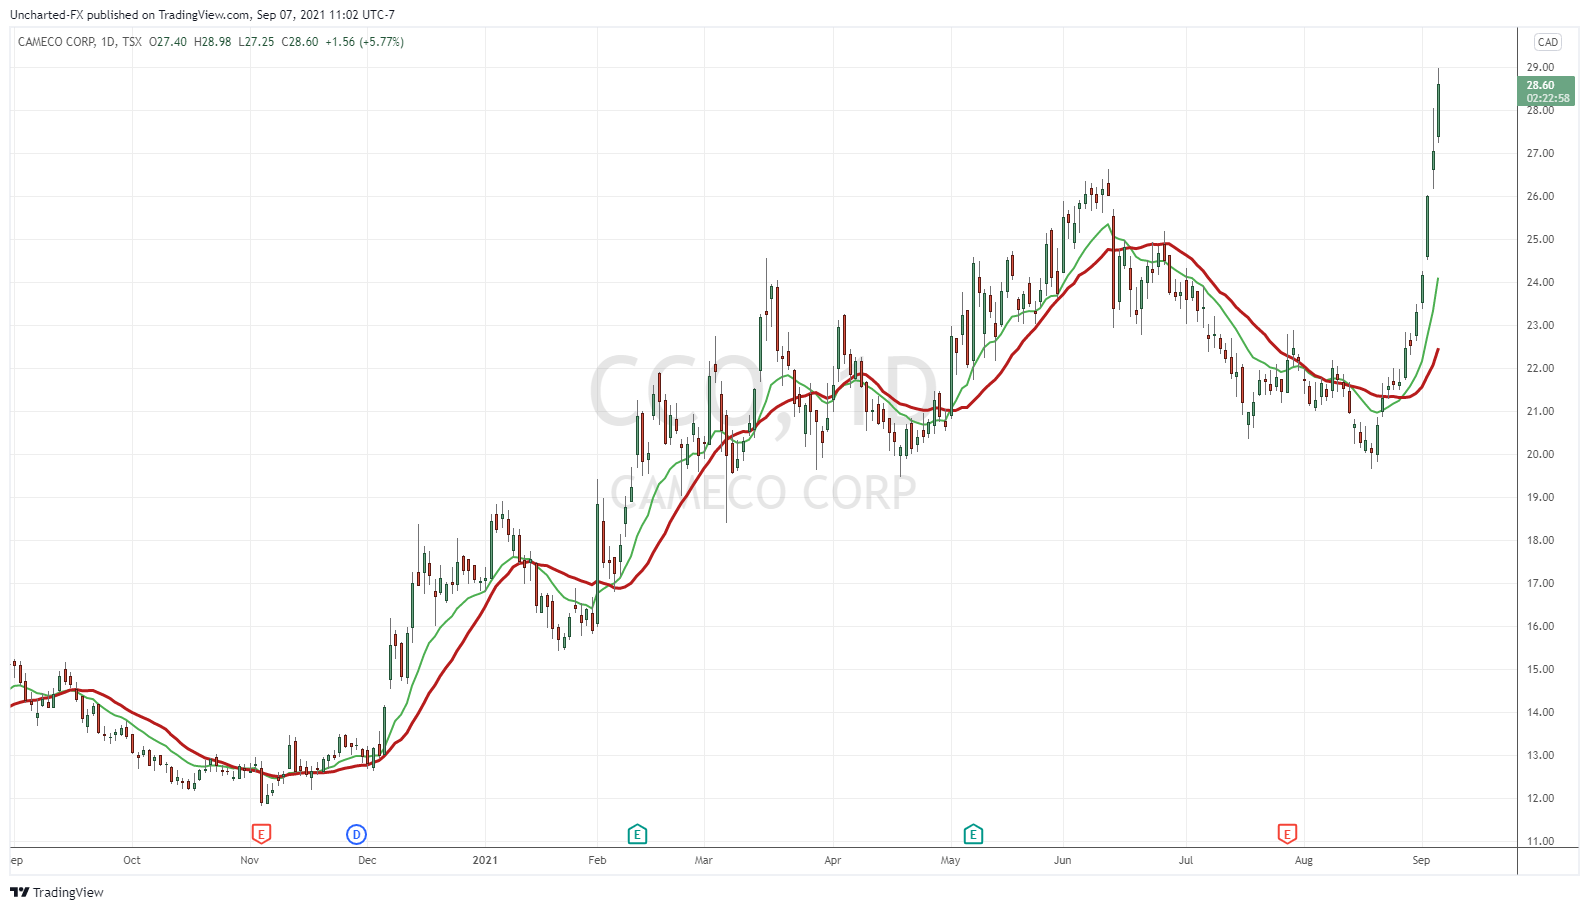
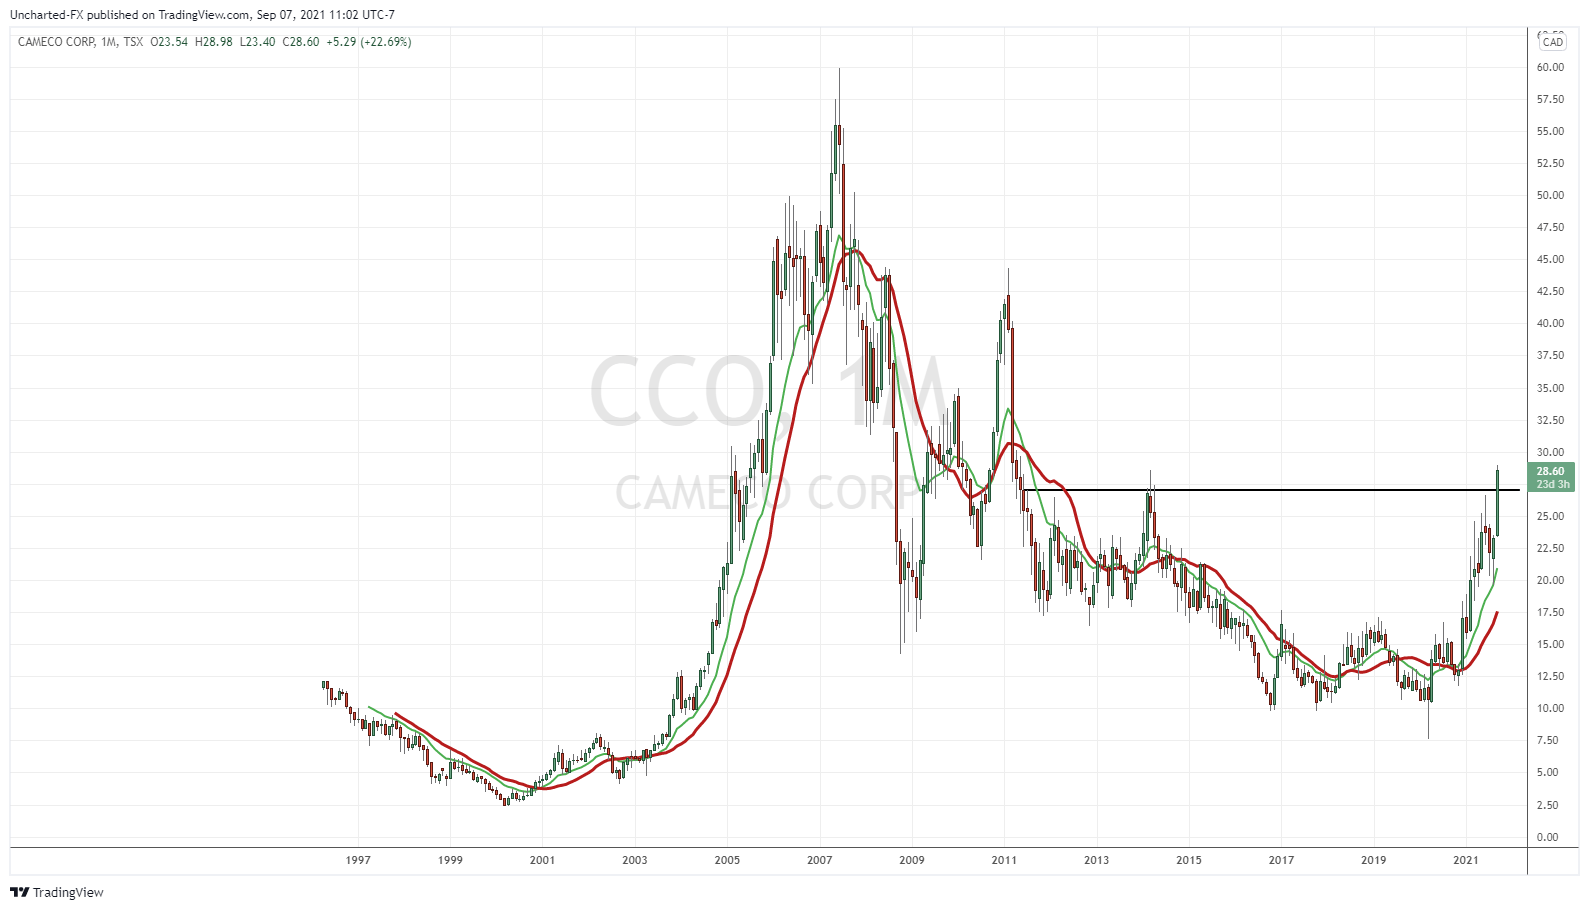
This is of course great for Uranium miners. Cameco (CCO.TO) is ripping and is taking out 2014 highs! And we are seeing big volume move into the Uranium stocks.
Other ways to play Uranium includes URA, the Global X Uranium ETF.
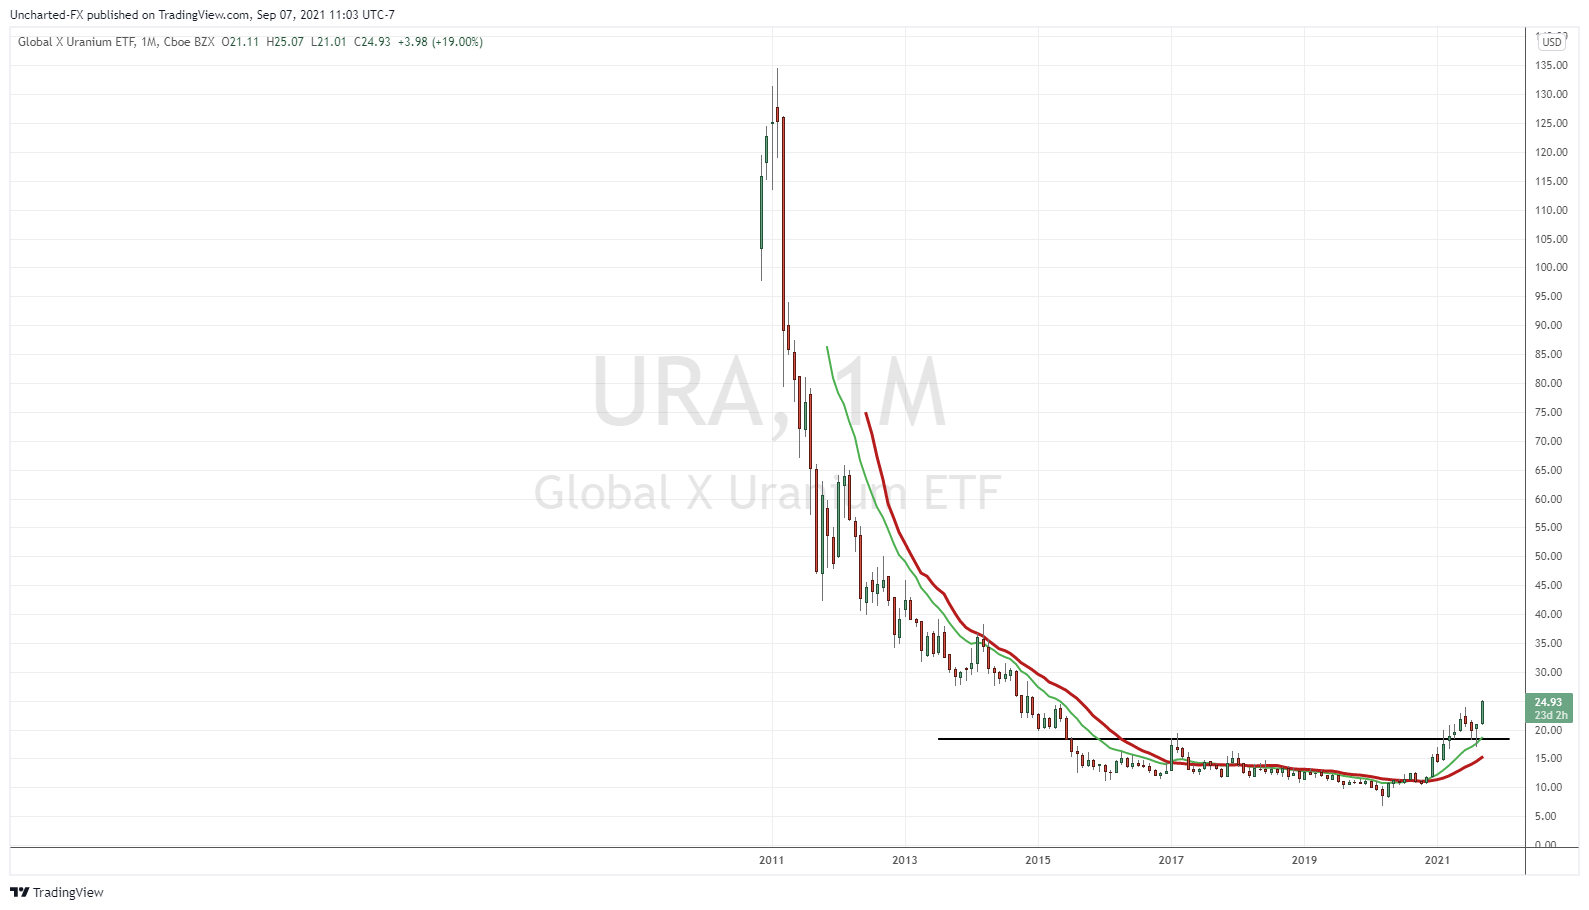
Just take a look at that monthly URA chart. Meets so much of our criteria. It looks like it has room to go…meaning it is likely Uranium cracks $40 per pound.
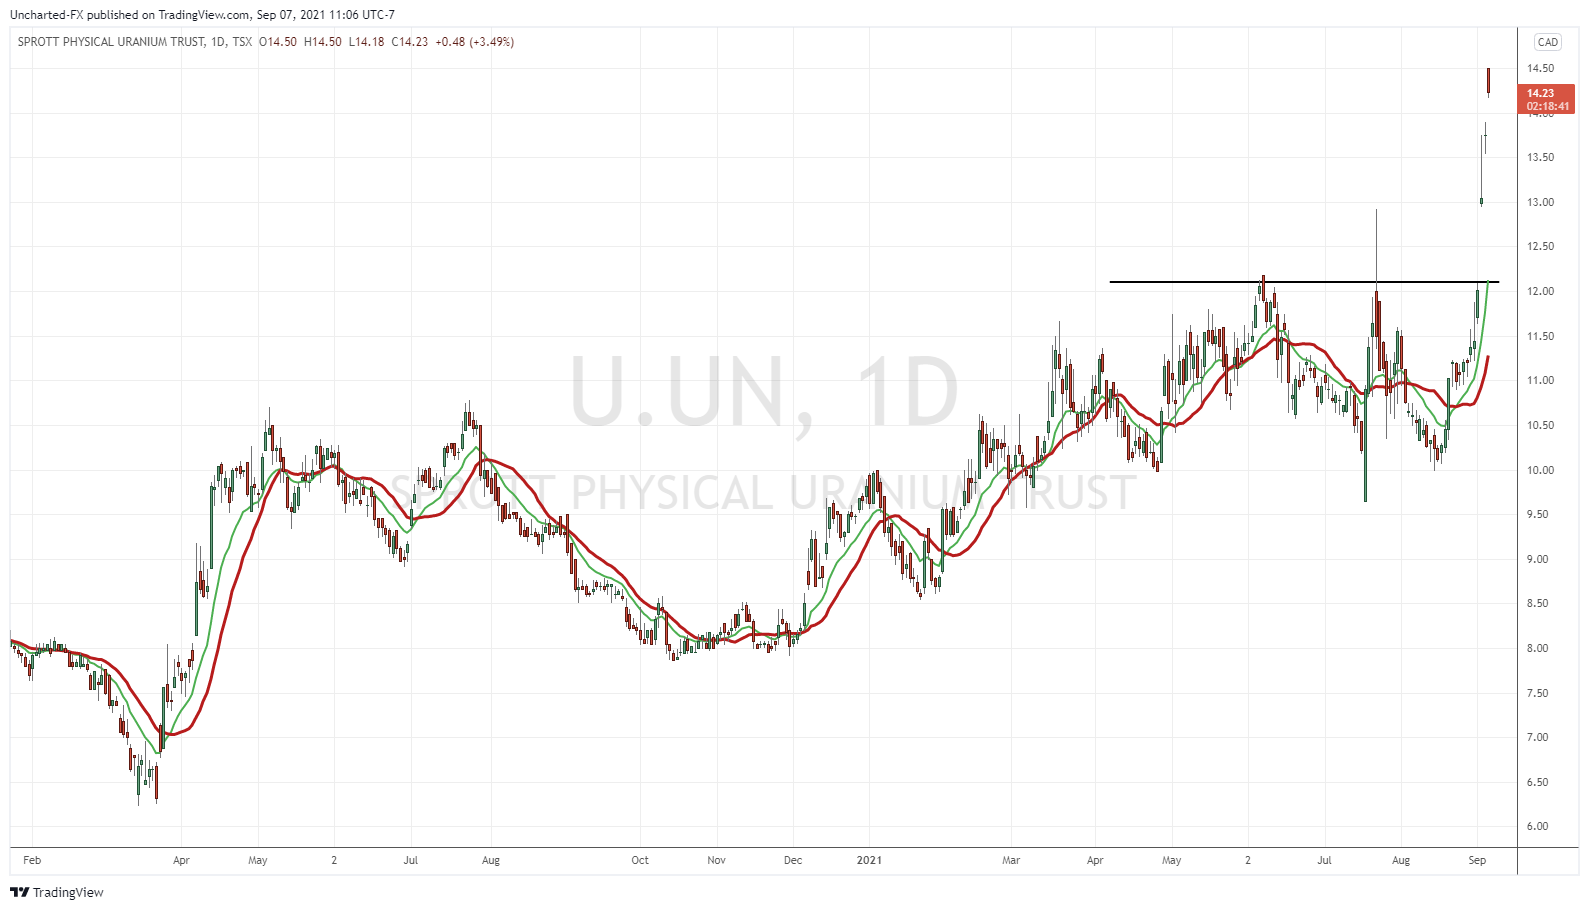
For Canadians (and Americans too), we can trade the Sprott Physical Uranium Trust (U.UN) which buys and stores physical uranium, and tracks Uranium spot prices.
Just as with Gold, when the commodity price moves up, the juniors or the small caps will move the same, but on steroids. That’s where the big gains happen.
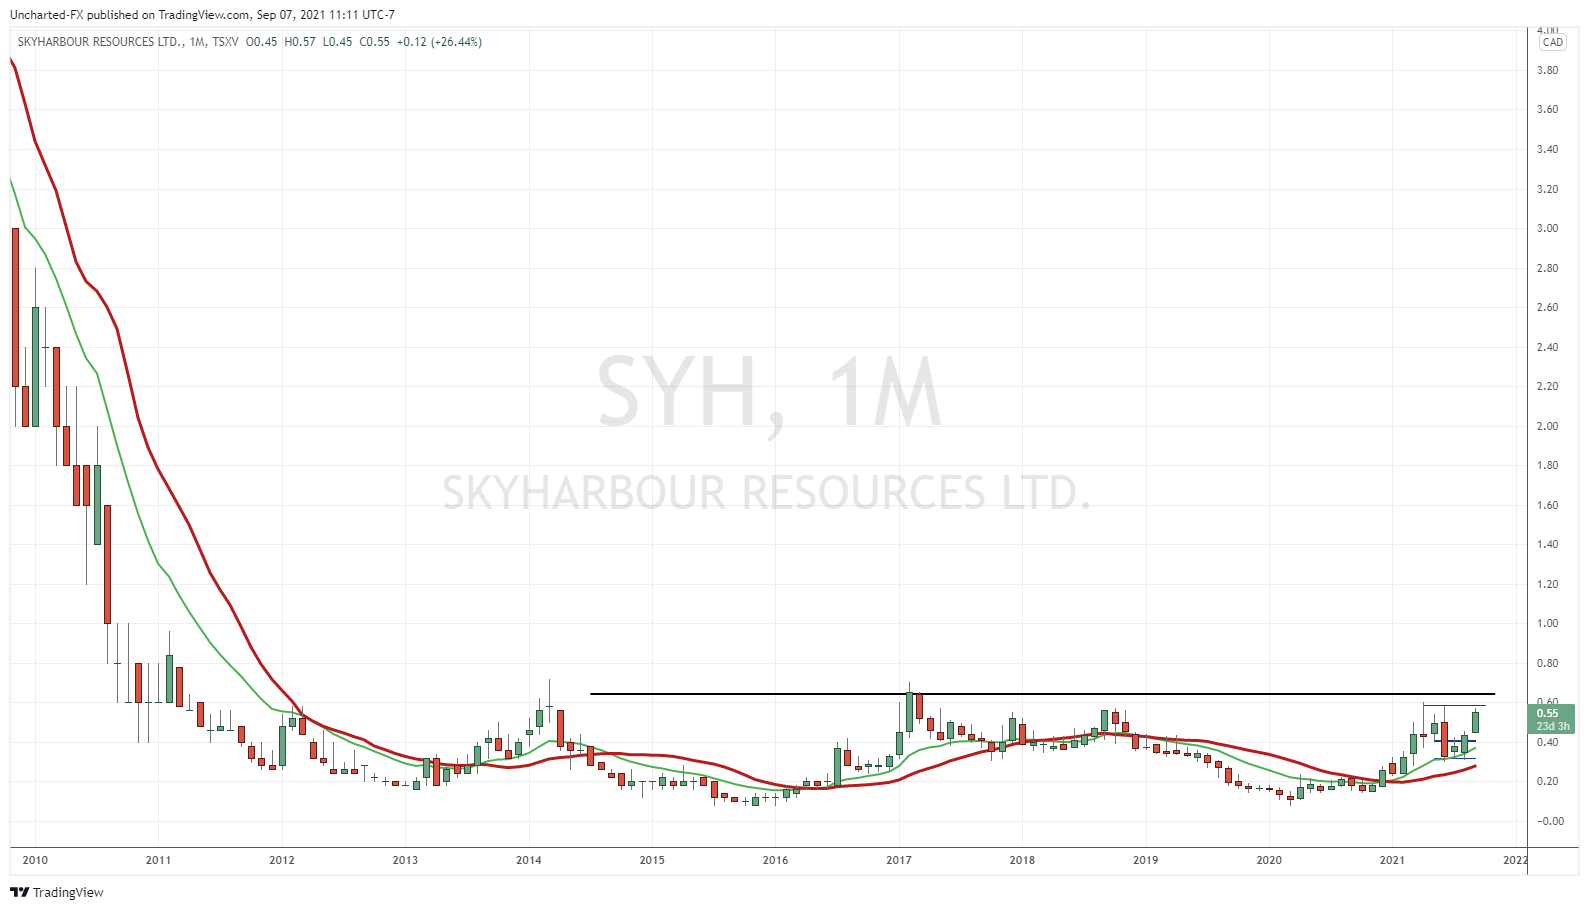
Take Skyharbour Resources (SYH.V) for example. A Uranium explorer in the Athabasca region. This is the area I would particularly focus on. And for good reason: the best grade Uranium in a safe jurisdiction.
Skyharbour’s flagship project is the Moore Lake Project, but recent news details updates on the East Preston project. They’ve completed a radiometric survey and provided updates for the remaining 2021-2022 program at East Preston. Read the details here, and be sure to check out Greg Nolan’s Deep Dive on Skyharbour Resources.
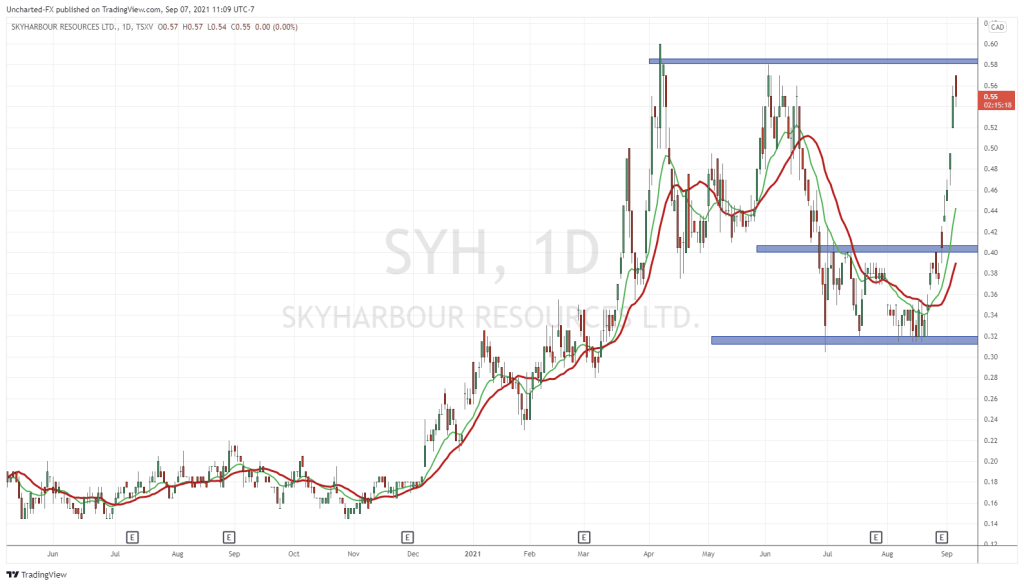
My focus is on the technicals. The Uranium charts are looking bullish overall, and Skyharbour is no exception.
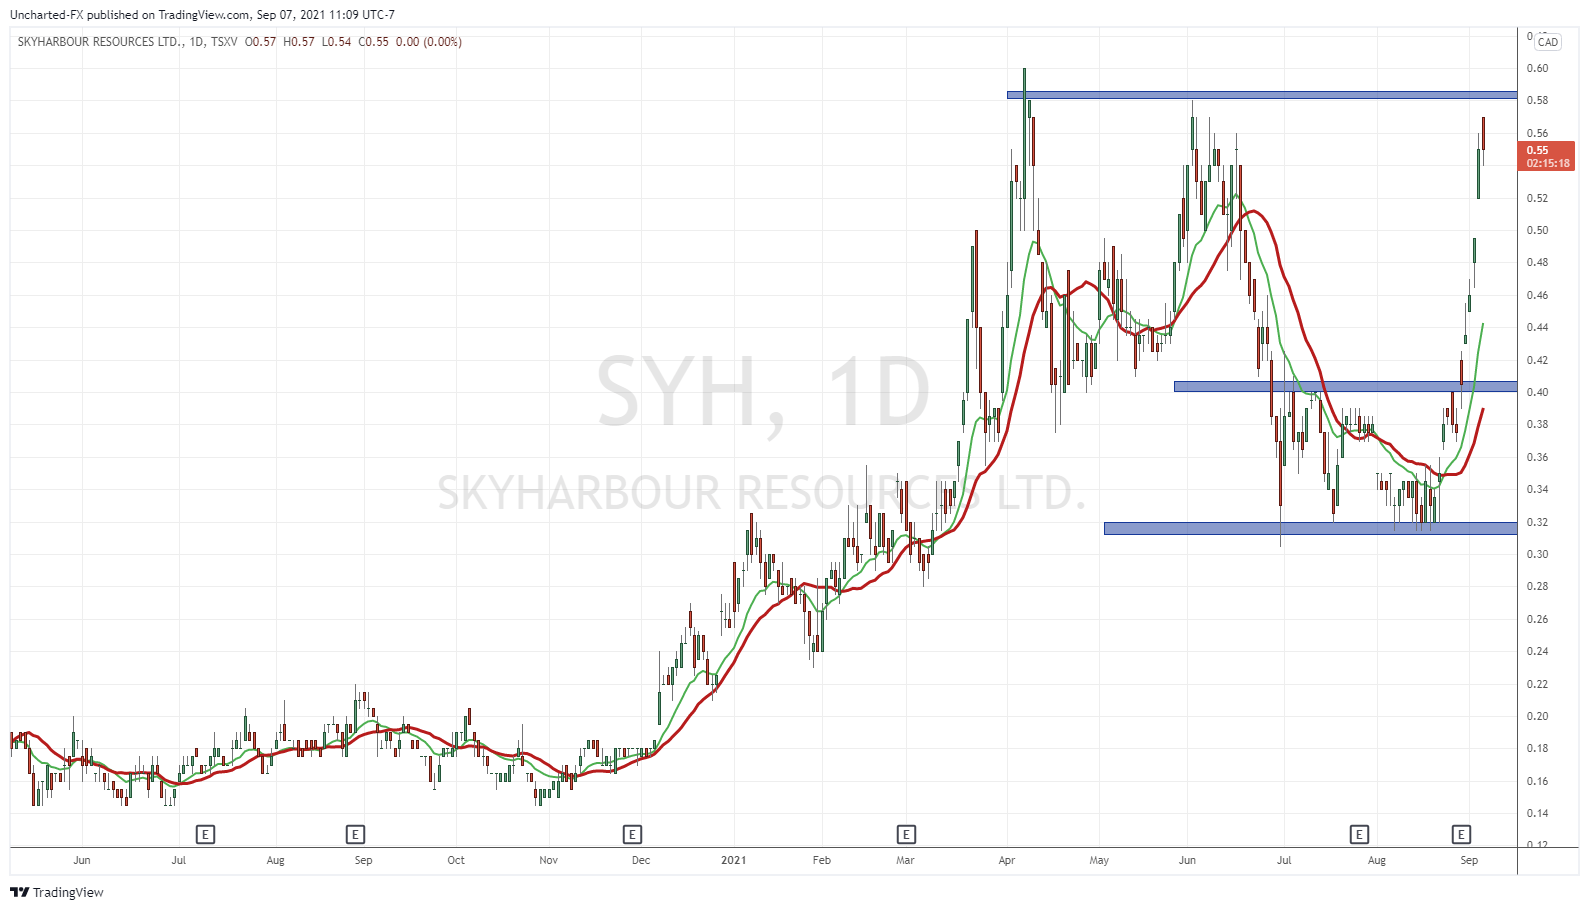
It was just last week when I was looking at the base on Skyharbour below $0.40. Almost a dirty looking inverse head and shoulders pattern. I say dirty but in trading, nothing is really textbook. This is why we focus on the structure, and the structure was indeed there.
A nice reversal print buoyed with the breakout above $0.44 to confirm a trigger. From then we flew. And now I am waiting for the test of resistance here around the $0.60 zone. Seeing some sellers so far which is expected as profits are taken at resistance. But if Uranium gets another leg higher, and we take out $0.60, we would be retesting levels not seen since 2017!
Going forward, we remain bullish on the Skyharbour chart above $ 0.44. A retest is possible before continuation as according to normal breakout criteria. Skyharbour is in the right place, they have been prepping for the next Uranium bull cycle, and they have experienced management and also good institutional backing including Marin Katusa. Raising funds for a catalyst won’t be a problem with the backing and with the surge in Uranium prices if need be.