The US Dollar (DXY) is making moves. I have covered the weekly chart of the Dollar sometime ago, but it is now time to take another look. The US Dollar chart is indicating an imminent breakout and a new Dollar Bull run.
For those that prefer video format, I got you covered:
At time of writing, the US Dollar (DXY) is up 0.10% while markets are dropping. Now, there are two reasons for why the US Dollar is moving higher.
Either, people are running into the US Dollar because of fear. Could be due to uncertainty, and new Covid variants etc. However, there is one other thing to confirm this move into safety: Bonds.
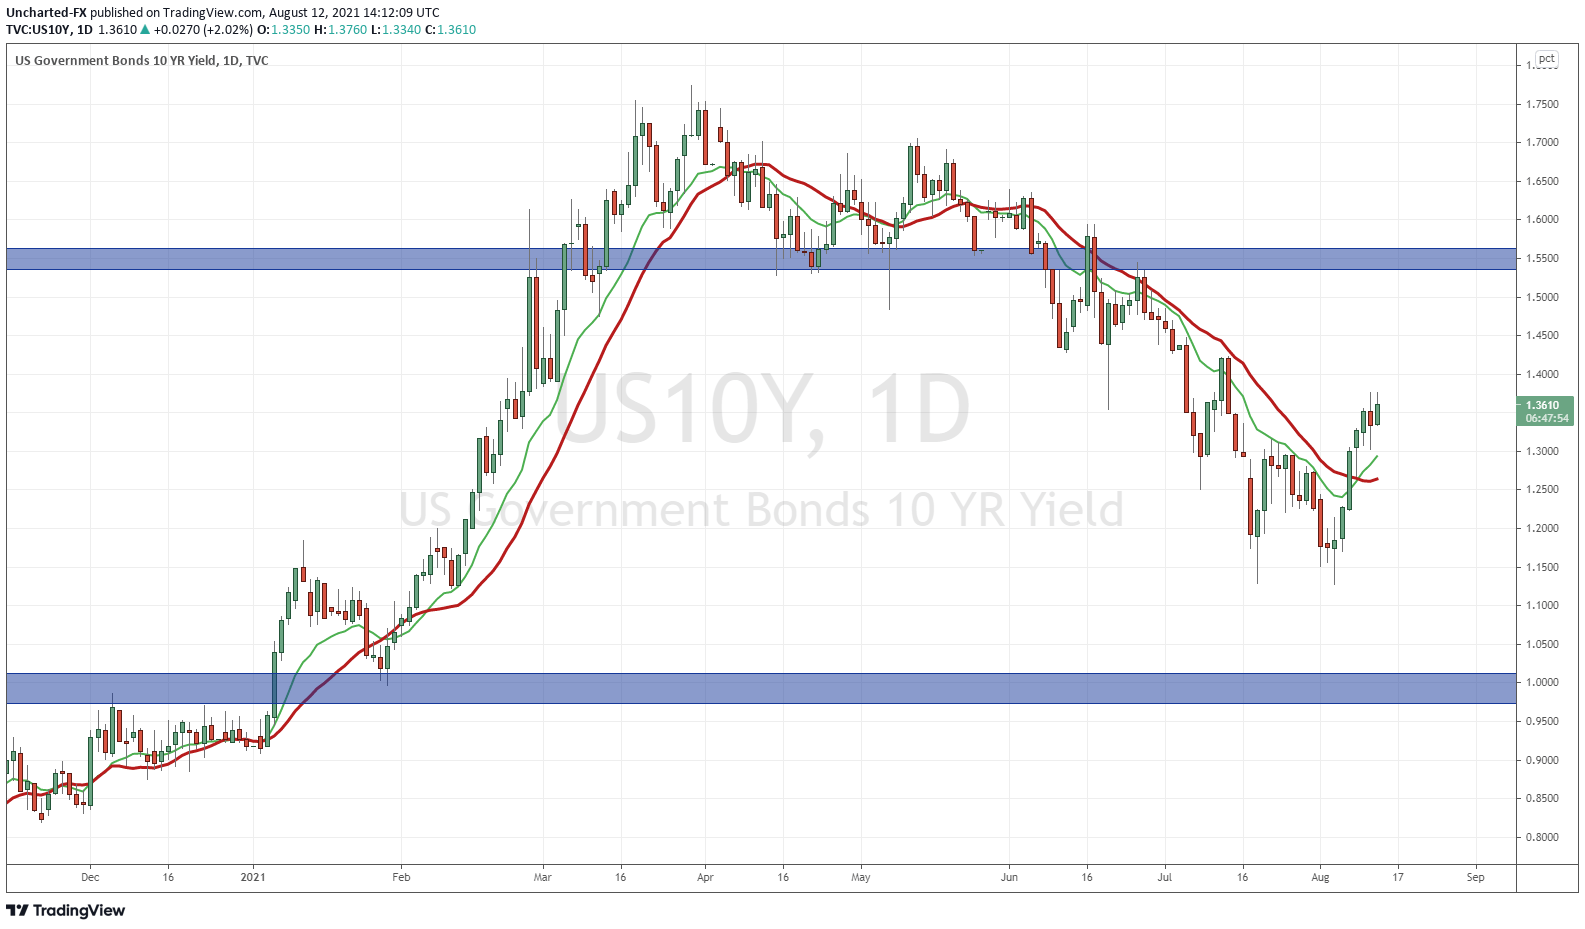
The 10 year yield is popping, which means that Bonds are moving LOWER. We tend to see both Bonds and the US Dollar move higher when it comes to a risk off move into safety. We aren’t seeing that in the past few days, so I think we can write this off.
The second reason is the more likely candidate. Money is running into the US Dollar due to interest rate expectations. We have heard about the Fed ‘”talking about thinking of tapering”. The market now believes the Fed really will have no excuse. Tapering and a more hawkish stance should be seen from the Fed either this month or the next.
The Fed has said it all depends on the data. Well since the last Fed meeting, we have had three data prints that warrant our attention. The big one was US NFP, or employment numbers which came out for July. Jobs came out at 943,000 beating analyst expectations of 845,000. One big important thing from this report was the US unemployment rate fell to 5.4% compared to analyst expectations of 5.7%. Both were good data points indicating the US economy is recovering.
Just yesterday we had US CPI data for the month of July. Consumer prices jumped 5.4%, but core inflation rose less than expected.
“Today’s CPI data should help assuage investor fears that the Fed is too laid-back about inflation pressures,” wrote Seema Shah, chief strategist at Principal Global Investors. “The details of the data release suggest some easing in the reopening and supply-shortage driven boost to prices, and tentatively suggests that inflation may have peaked. Investors in the transitory camp will feel slightly vindicated.”
And then finally today’s US Jobless Claims came out to 375,000, which is a fall for the third straight week. What might irk some of the contrarians, is that Powell and the Fed according to this data, may be correct on their transitory inflation story. We’ll have to wait and see.
Technical Tactics
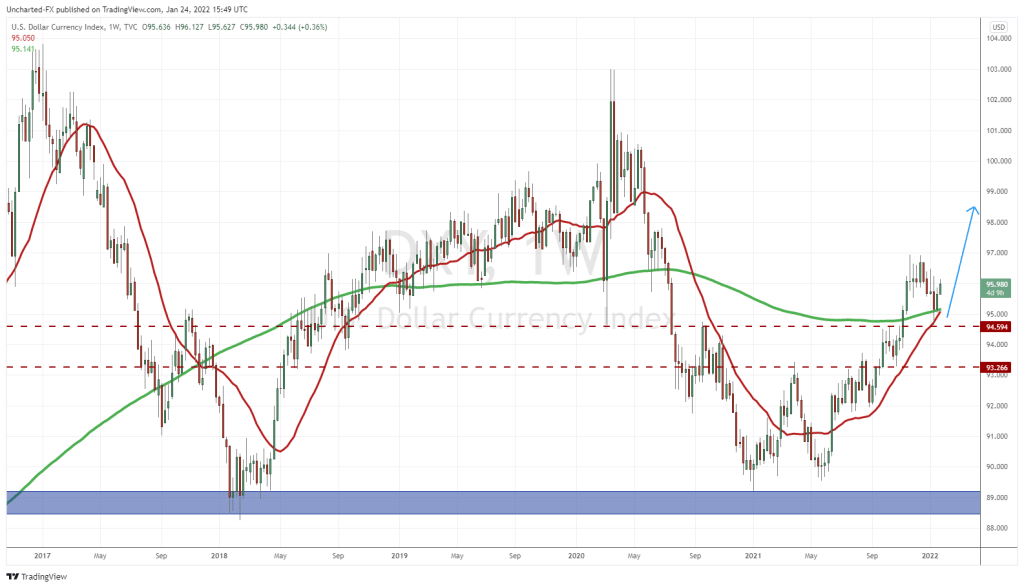
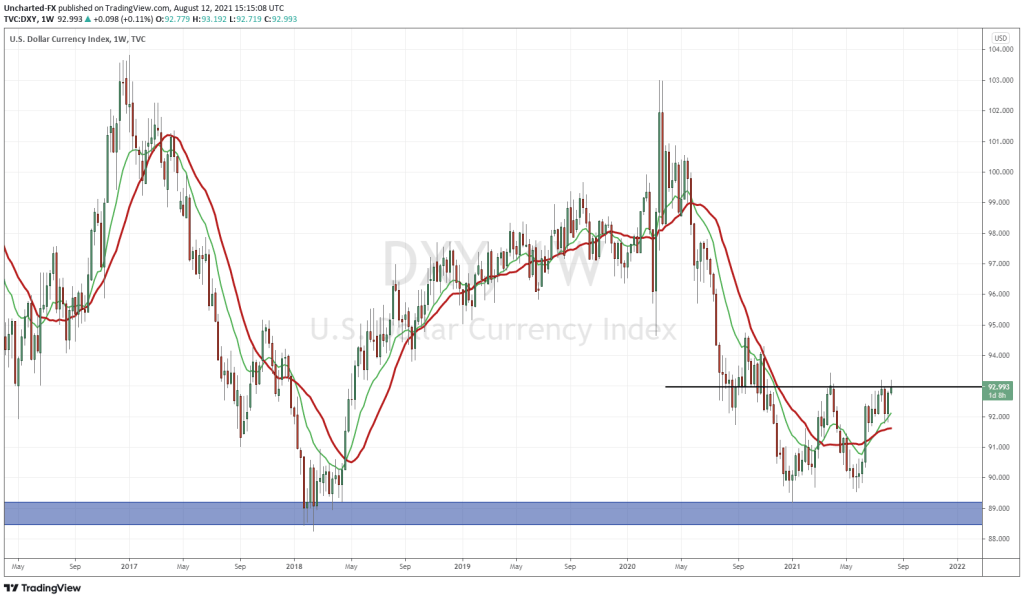
I have said it before, but I will say it again, the US Dollar chart is one of the most important macro charts to be watching these next few weeks. The last time a bull run occurred on the US Dollar was back in 2018. In a world running into a currency war, things can get shaky with a stronger dollar, especially if you factor in emerging market dollar denominated debt.
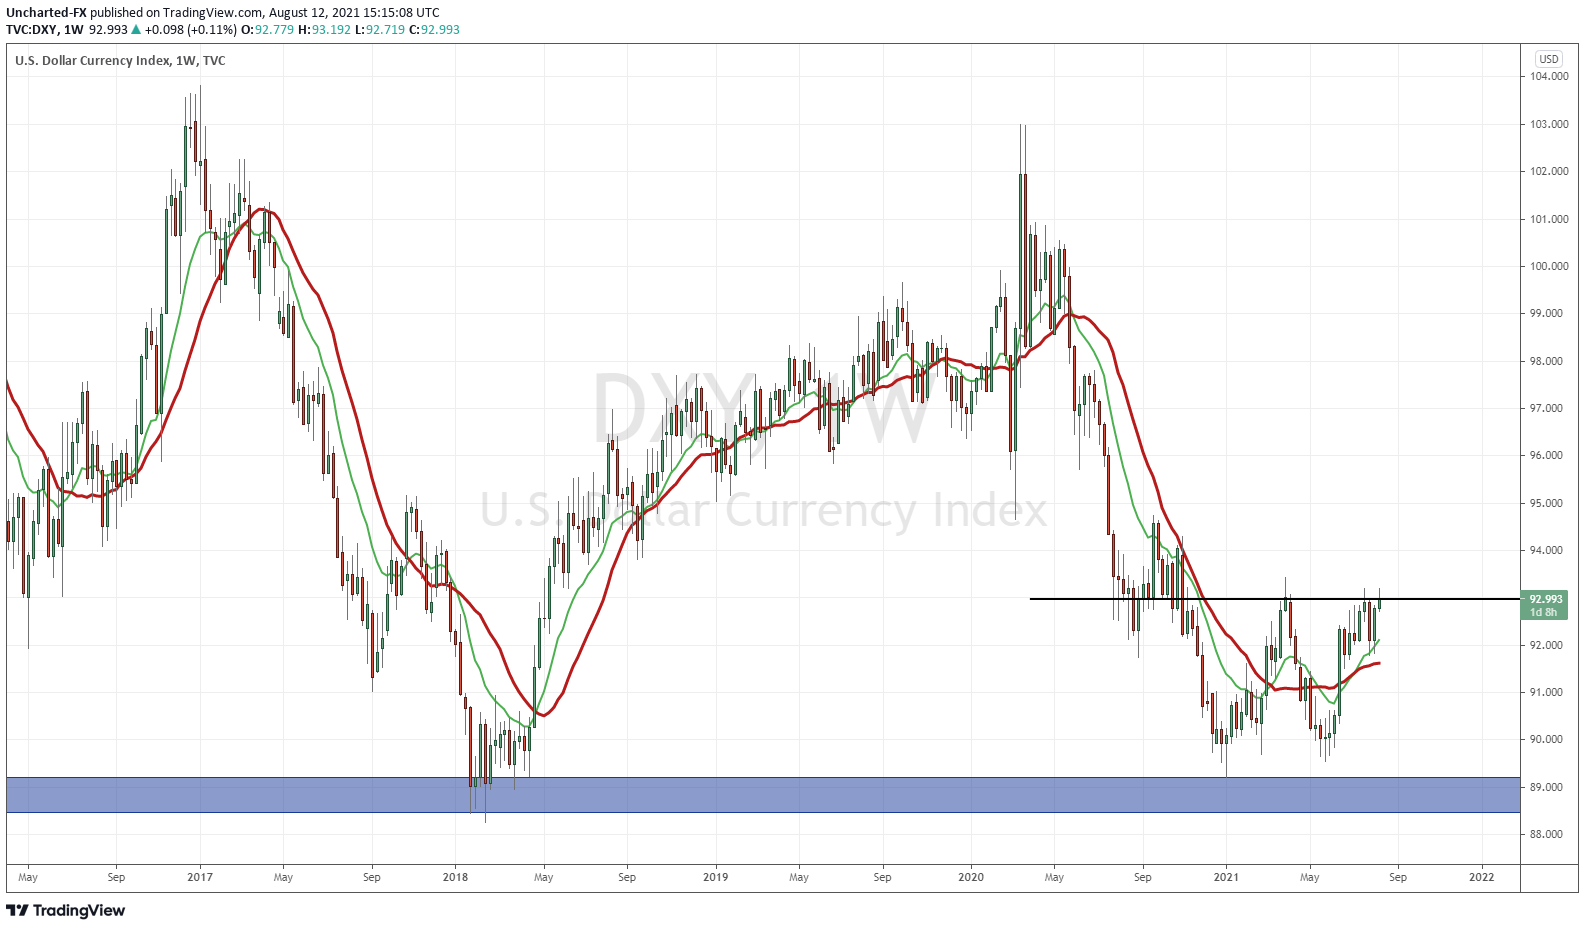
The US Dollar bounced at a major support zone of 89. In the past few weeks, I have been warning of a potential double bottom pattern triggering. If this occurs, we are in a new US Dollar bull trend. But as my readers know, the key is the breakout trigger. In this case, we need to see a weekly close above 93. If we get a close above 93 tomorrow (Friday), we will trigger that weekly chart breakout. The following week then determines whether we continue the momentum (with either a retest or just straight up move higher), or if it is a fakeout (retest fails).
If we closed right now, we would have a rejection, but that doesn’t mean the chance of a Dollar bull run is over. If we do not close above 93, then watch for a close below 91.70 going forward. That would ease fears of a Dollar bull run anytime soon.
I say that because while some Americans may want a stronger Dollar, the Gold bugs do not. Gold has a negative correlation with the US Dollar, hence why some call it the anti-dollar. If the Dollar rises, Gold drops and vice versa.
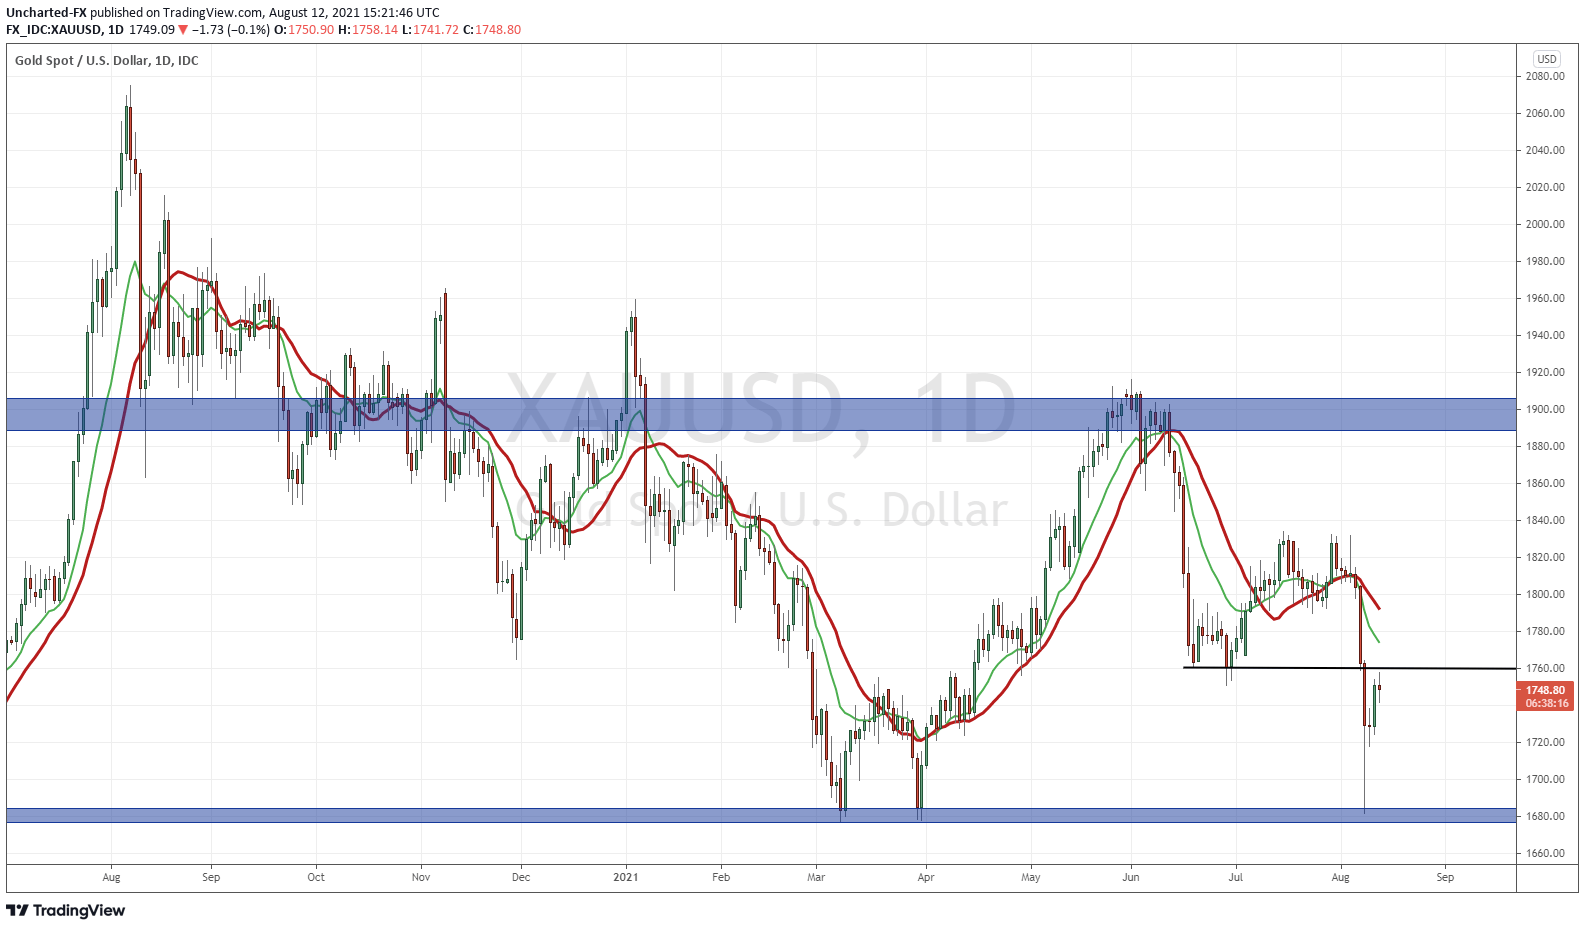
1680 is a major support zone for the yellow metal. Buyers stepped in after that crazy flash crash to start this week. Unfortunately, it may not be over just yet if the US Dollar gains strength. I will do a deeper dive on Gold next week, but as of now, this $1760 zone is key. The zone we are testing right now. It is a retest of resistance, meaning sellers would pile in again here. If we break and close above, things start to get rosier.
Before I end, I want to leave you off with this piece. In it, I mentioned why deflation might be the real threat and NOT inflation as the media and everyone in financial markets is saying. These are the three signs for big money pricing in deflation:
- Lower Interest Rates (A Rise in Bond Prices)
- A Fall in Foreign Currencies, or a Rise in the US Dollar
- Falling Gold Prices
Keep this in mind when analyzing the US Dollar and Gold’s next long term move.