

Universal PropTech (UPI.V) is one of the companies that has been quite popular among the members of our Discord Trading/Investing Room. So much so, that I am often asked to cover the company in a Market Moment. Sorry for the delay, but here it is.
I am very excited about what I see on the technicals on Universal PropTech’s chart. Price action indicates a high probability set up with an excellent risk vs reward. But before we dive into the charts and patterns, let’s cover some basic fundamentals.
Universal PropTech is all about utilizing advanced technologies and control systems for healthy buildings in a COVID and post-COVID affected environment.
Recently, the company provided an update on their Spotlight-19 Technology, which included an expected COVID detection time of under 20 seconds, and at an approximate cost of $1.00 per COVID-19 test.
From the Press Release:
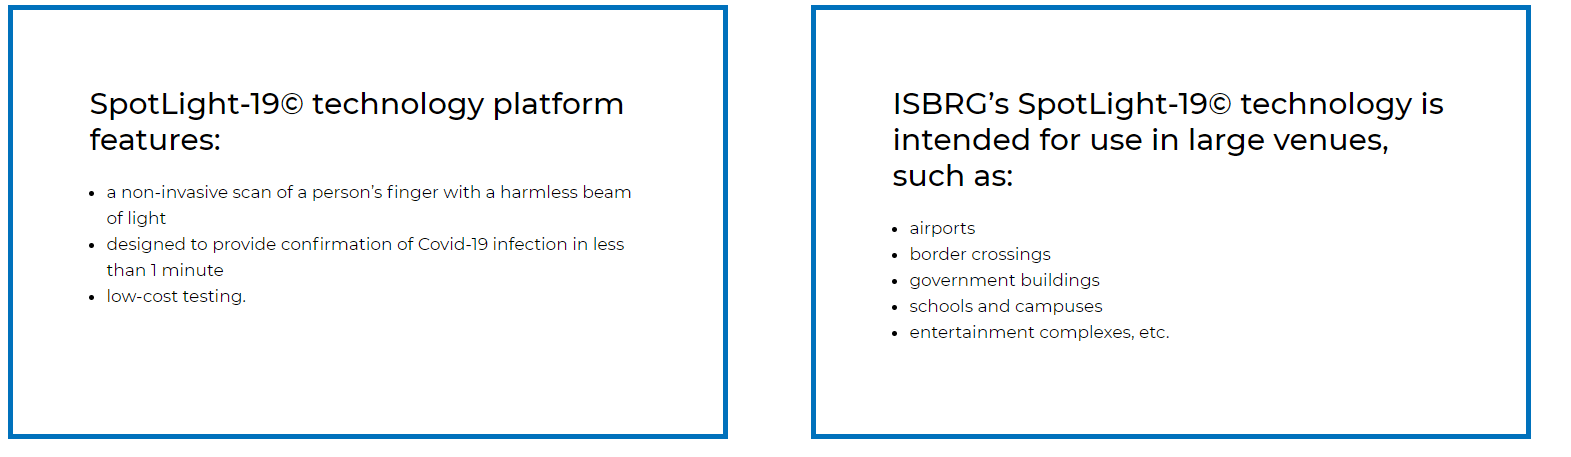
ISBRG’s SpotLight-19© technology leverages advancements in optics and artificial intelligence to define a state of COVID-19 infection.
SpotLight-19© (which upon testing to establish specificity and sensitivity ISBRG intends to submit for regulatory approval) is designed to screen for a unique infectious state – within 20 seconds of scanning a fingertip with light. ISBRG is undertaking trials to determine SpotLight-19©’s efficacy in detecting COVID-19, and if proven effective, will be subject to further regulatory approvals before it would be commercially available.
The speed and estimated cost of the test (approximately one dollar), combined with the non-invasive nature of light (no body fluid of any kind is required), is intended to accommodate the testing of large numbers of people without the inconvenient delays and environmental damage associated with current chemical reagent-based tests.
Universal PropTech is not just a COVID play. It is a technology play. The company already has a strong operational history, and UPI’s wholly-owned subsidiary, VCI controls INC’s building control solutions has been used in Federal Government facilities for over 40 years.
I also suggest my readers to take a look at Universal PropTech’s portfolio, which includes LuminUltra microbial monitoring, Air Sniper, Fresh-Aire UV, and AtmosAir.
Future investments by UPI in proptech solutions will include:
- Utilizing UV to sanitize building environments
- Energy Efficiency AI/Machine Learning
- Energy Management of supply and demand loads with AI/Machine Learning
- Heat recovery systems
- Thermal optimization systems
- Fintech
Exciting times for the company, and its growth prospects are high (Smart Cities play too anyone??). But I know many of you are dying to hear about the charts.
Let’s take a look at the technicals.
Technical Tactics
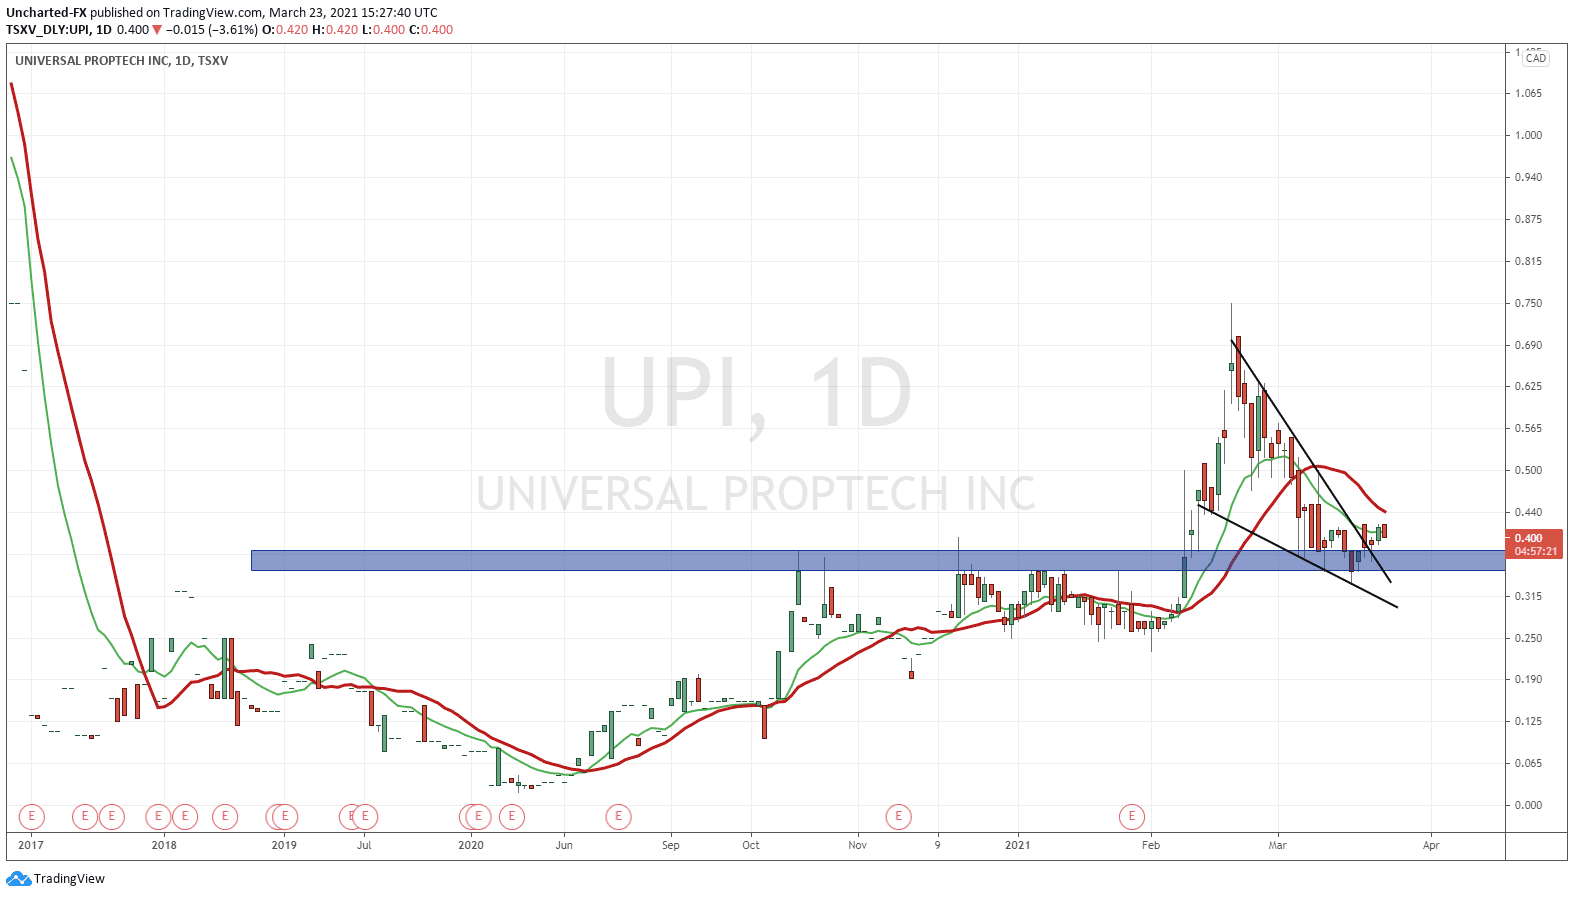
Going to the daily chart of Universal PropTech, regular readers and Discord members will probably see why the current zone is very crucial.
UPI is at a major support zone, or price floor. In fact, in mid February we broke above $0.355 which was once resistance (price ceiling) and is now acting as support. Buyers have held this crucial zone for 14 trading days.
This zone can act as the springboard for a move to the upside as buyers continue to hold support. All that is required for that momentum is some sort of catalyst from the company.
Some technical analysts amongst you may have spotted the wedge pattern which I have drawn out. This has also broken which adds more confluence to the bullish side.
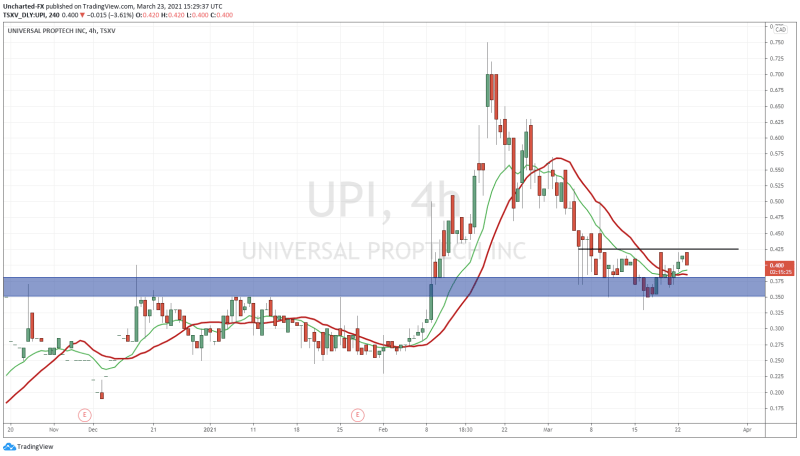
Going down to the 4 hour chart, and we see signs pointing to more upside. It seems that we are printing an inverse head and shoulders pattern at this support! The quintessential reversal pattern. It might not look textbook, but rarely anything is in the world of trading.
![Inverse Head and Shoulders Pattern [2020 Update] - Daily Price Action](https://e4njohordzs.exactdn.com/wp-content/uploads/2021/11/Inverse-head-and-shoulders-pattern.jpg?strip=all&lossy=1&w=1920&ssl=1)
The neckline break is what will trigger this pattern. This comes in at $0.425. We get a break and close above this, the pattern triggers and we should expect to see momentum.
Price targets? Well just using the charts, $1.00 is a major psychological resistance zone, and then we do not see any resistance until $1.40.
There you have it. A company with great growth potential, and the chart is indicating a move higher going forward.
At time of writing, UPI is down 4.82% and trading at $0.395.