

We called it. Last week on Friday where I discussed the almost 8% drop on oil prices, a reversal pattern was brewing. Things were not looking great for the lifeblood of the economy.
Just to refresh your memory, this was what I predicted:
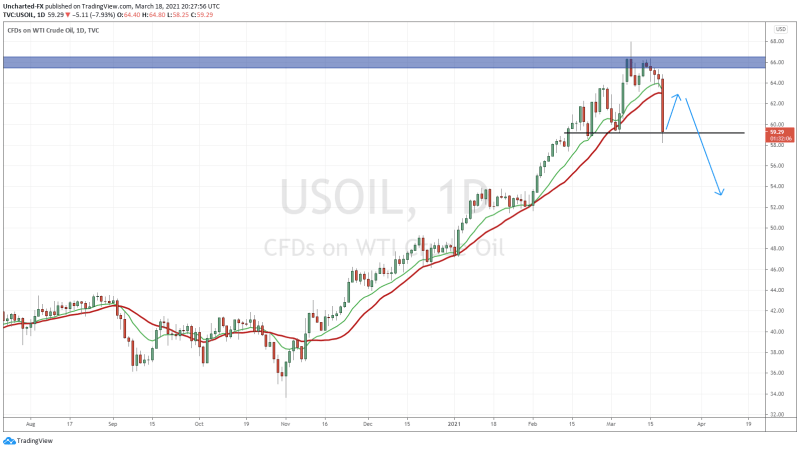
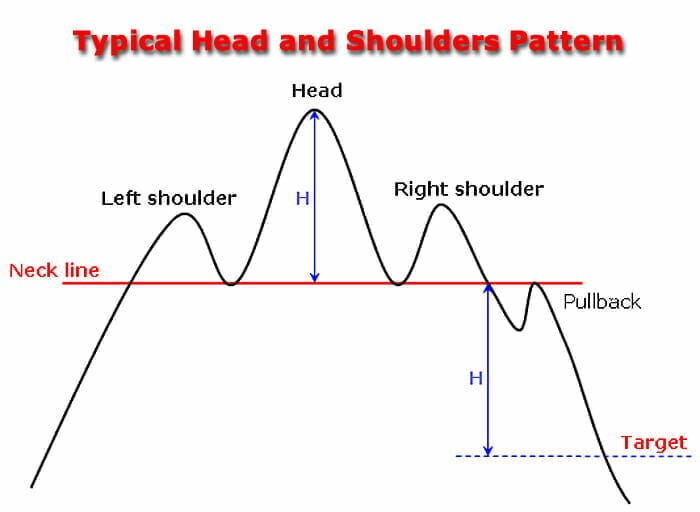
The structure of the head and shoulders reversal pattern has played out and triggered. We have a close below the $59.25 support zone, but more on that in the technical tactics portion of this morning’s Market Moment.
But why have oil prices tanked?
There was nothing out from OPEC. I personally think it was just a technical drop. $66 was an important resistance zone, and long traders targeted that zone for taking profits. Buy orders now become sells. Short Sellers also short at resistance which only adds further downside pressure.
The media initially said that this Oil price drop occurred because traders are fearing new lockdowns:
Europe’s demand recovery is set to take another hit with Germany, France and Italy all having widened lockdown measures this month. Meanwhile, coronavirus cases are surging in India and threatening the economy’s recovery from recession.
New variants, and currently the news regarding Astrazeneca falsifying effectiveness data, are just adding more uncertainty to the idea that the global economy will be re-opening soon.
And then this happened:
Oh sorry this:

A ship “Austin Powered” the Suez Canal blocking the vital shipping lane. But it seems that the massive cargo ship is now on the move.
Market Analysts blamed this blockage for the price action on oil prices.
I want you to all indulge me and put on your conspiracy caps. Well, it is not only me talking about this, but many top traders and analysts on twitter are mentioning this is all about the rising yields, as no major fundamental news (including the Suez Canal blockage) would cause an oil reaction drop as we have seen.
Inflation is the key word.
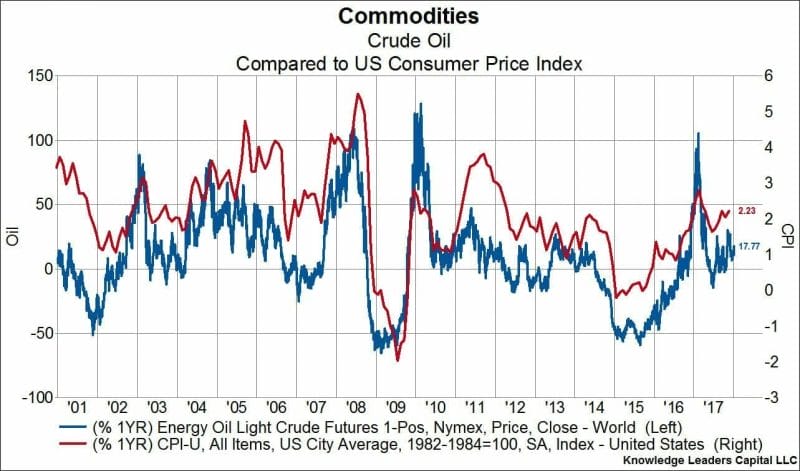
Energy plays a large role in the inflation measurement: consumer price index. So much so, that we even calculate a separate CPI excluding food and energy.
Tons of analysts are speculating that the Fed will be hiding real inflation with rising oil prices. The key here would be some event to spike oil prices. The Fed can then say that rising oil prices are causing inflation to spike above their 2% threshold BUT this inflation is ‘transitory’ and not steady. Therefore, they will not hike rates nor reverse policy. Because it is not money printing which caused prices to rise, but rather this spike in oil, this is something out of the Fed’s control.
Clever way to mask inflation.
Alternatively, some traders are seeing the opposite. That this drop in oil is by design to deal with rising yields. Since oil prices are already high, a significant drop would hamper and dampen future inflation numbers. This would therefore mean that trader’s would price in an interest rate hike much later….even though the Fed has told us there would be no rate hike in 2021 as their metric of steady inflation of 2% would likely not occur this year.
So we must ask again: is inflation the key? (And do we live in times with managed markets?)
Technical Tactics
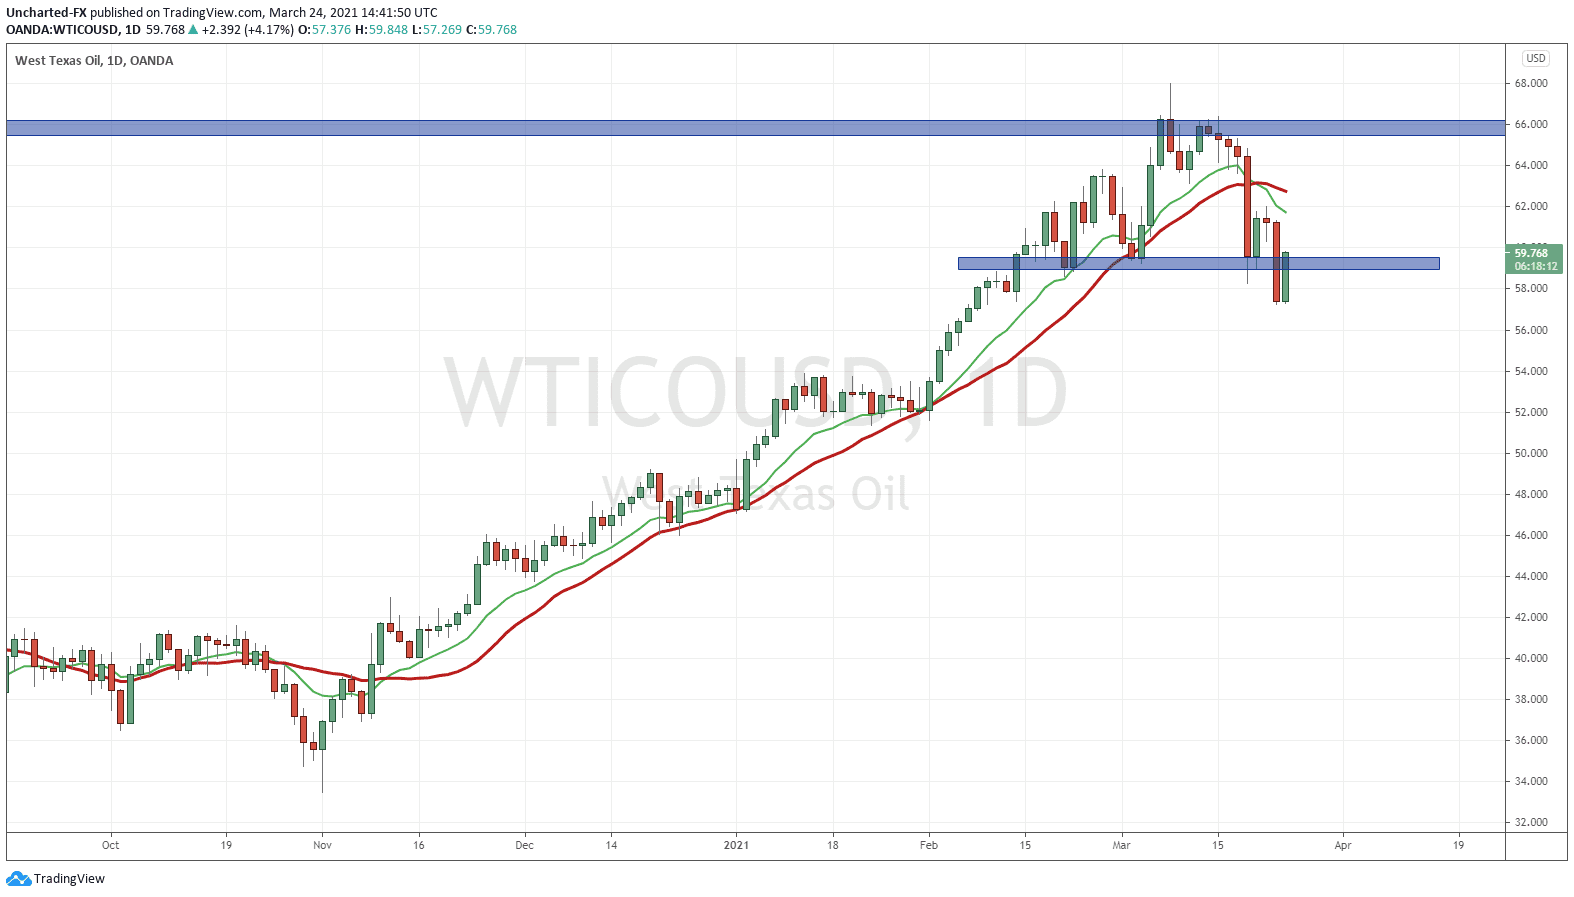
As alluded to earlier, our prediction played out. Just pure market structure, and comes from experience observing price action for years. Nothing moves up or down forever. We expect trends to occur in waves. And these trend reversals begin at major support or resistance zones. In this case, $66 is a major resistance zone for oil.
The breakdown was triggered yesterday with the daily close below support at the $59 zone. Currently, prices have pulled up and the retest of the breakdown is now in play.
We are at that pullback stage.
It all now depends on how this daily candle closes. If it is a very strong green close, we have likely created a fake out, and oil price moves higher. If we begin to see some selling pressure anytime from now until the end of the trading day, our reversal is still intact.
If you want to remain a perma bear on oil, the right shoulder, or $62.05, would be your pivot point. As long as prices remain below, the downtrend is still in play.
Price targets to the downside if this head and shoulders reversal plays out? There is a flip zone around $52.00, and then the major psychological zone of $50.00.