
Oil has been making weekly appearances on Market Moment, and for good reason. It has been front and center on mainstream financial media, largely thanks to the Suez Canal blockage.
Oil has been a rewarding trade for our readers and I. The $65-66 zone was our resistance target to the upside. Readers were given the possible scenario’s for when Oil reached our target. Very simply: we either broke out and continued much higher, or we reject and sell off. My bullish stance was largely due to commodities being cheap, and being the hard assets longer term investors would run into given the monetary policy that central banks are embarking on.
More money printing. And it cannot stop…but more on Central Banks in just a bit.
A few weeks ago, I warned our readers that Oil HAS reached our target, and we should be cautious, and even expect a reversal pattern. What happened? A large 8% sell off on Oil to end the week. It had a lot of people scratching their heads. I called it as a technical rejection.
That was not the end of it. We anticipated a possible head and shoulders pattern on Oil. Which then triggered, but has so far, not seen any momentum to the downside. We will explore this under Technical Tactics.
More Power to the Princes
As soon as Oil showed signs of weakness we got hit by three major news: First of all the Houthi’s decided to strike Saudi Arabian Oil refineries with drones, the Suez Canal fiasco (although CNBC is reporting the ship has been refloated and moved, and the Suez Canal traffic has resumed), and then to top it off, a major explosion at an Indonesian refinery. All headlines and events to prop Oil prices.
As someone who has observed and traded markets for 9 years, these kind of news stories do not surprise me anymore. They tend to occur when major technical zones are reached. Hence why I am a big advocate for technicals and price action. Charts can display when big money is entering or exiting, which usually points to some sort of news coming down the line.
In my last Market Moment post regarding Oil, I did put on my conspiracy hat, and talked about why the Fed might want higher Oil prices. I will delve into this rabbit hole once again.
Before I do, I want to highlight the work of German Economist Richard Werner, and his outstanding book, “Princes of the Yen”. The book is rather expensive on Amazon, but there was a great documentary released about the book which can be viewed on Youtube, or on Amazon Prime.
Mr. Werner explores the role of the Bank of Japan in creating the Japanese post-war boom and bubble economy. The book looks at the actions of other central banks, and then explores the role of central banks…and the fact that they are not held accountable by governments. Most central banks today are independent and privately owned. The old saying that the Federal Reserve is no more Federal than Federal Express holds true.
The actions of central banks cannot be impeded on by elected officials. Central banks have been at the center of all social, political and economic cycles. Central Bankers are Princes and Kings.
Highly recommended for anyone wanting to understand economic history and how central banks function.
Werner deviates from the classical economists and keynesians. He proves in his work that credit creation is the true power of central banks. His approach on inflation is refreshing, as it ties in well with classical economics elements.
The role of central banks and banks is to create credit. A growth in money supply is not inflationary if this money goes to productive means. This creates more products and services which leads to an increase in the demand for money which then warrants the increase in money supply. This occurs until an economy reaches a certain capacity.
Conversely, if this money is used for unproductive means, such as speculating on real estate and stocks, we will see inflation because we now have more money in the system, competing for the same number of goods and services (no increase as credit did not flow into productive means).
I say this is close to the classical school, since they focus a lot on the supply of money, and see inflation as the decline in a fiat currency, ie: it takes more of a weak currency to buy something hence increased prices.
The goal of this post is not to attack keynesian economics, but to point out there are other ways to gauge and define inflation…and that central banks are very powerful institutions.
Oil Prices to Mask Inflation?
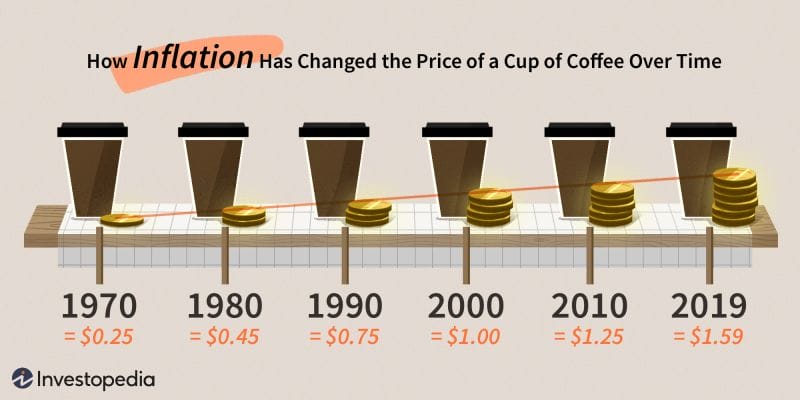
So I now ask once again: is the Federal Reserve using Oil to mask inflation? We have seen asset prices increases, and for the average person, living costs are getting more expensive. We are seeing an increase in prices, but the central banks are telling us the data does not indicate this.
Oil is the lifeblood of the economy. It plays a large role in the Consumer Price Index, how inflation is measured, because the average person does fill up their vehicles on a regular basis. If Oil prices rise and continue to climb, it will impact the inflation data as economies re-open.
We know the Fed will not increase interest rates until 2% inflation is ‘steady’ and not ‘transitory’.
Using Mr. Werner’s definition of inflation, money is being printed and is being used for unproductive means. Mainly speculation. We should expect to see inflation.

What better way for the Fed to mask inflation than rising Oil prices? Going down the rabbit hole, the key for this would be some sort of event to drive Oil prices much higher. For our technicals, we need Oil to push back above $66.
An event which raises Oil prices AND takes inflation above 2% would allow the Fed to hide the inflation from their monetary policy by blaming this event. AND they could get away with NOT raising interest rates since inflation is ‘transitory’ due to higher Oil prices.
Technical Tactics
Both West Texas and Brent Crude Oil are very similar in market structure, but I will be focusing on the chart of USOIL, or the West Texas variant.
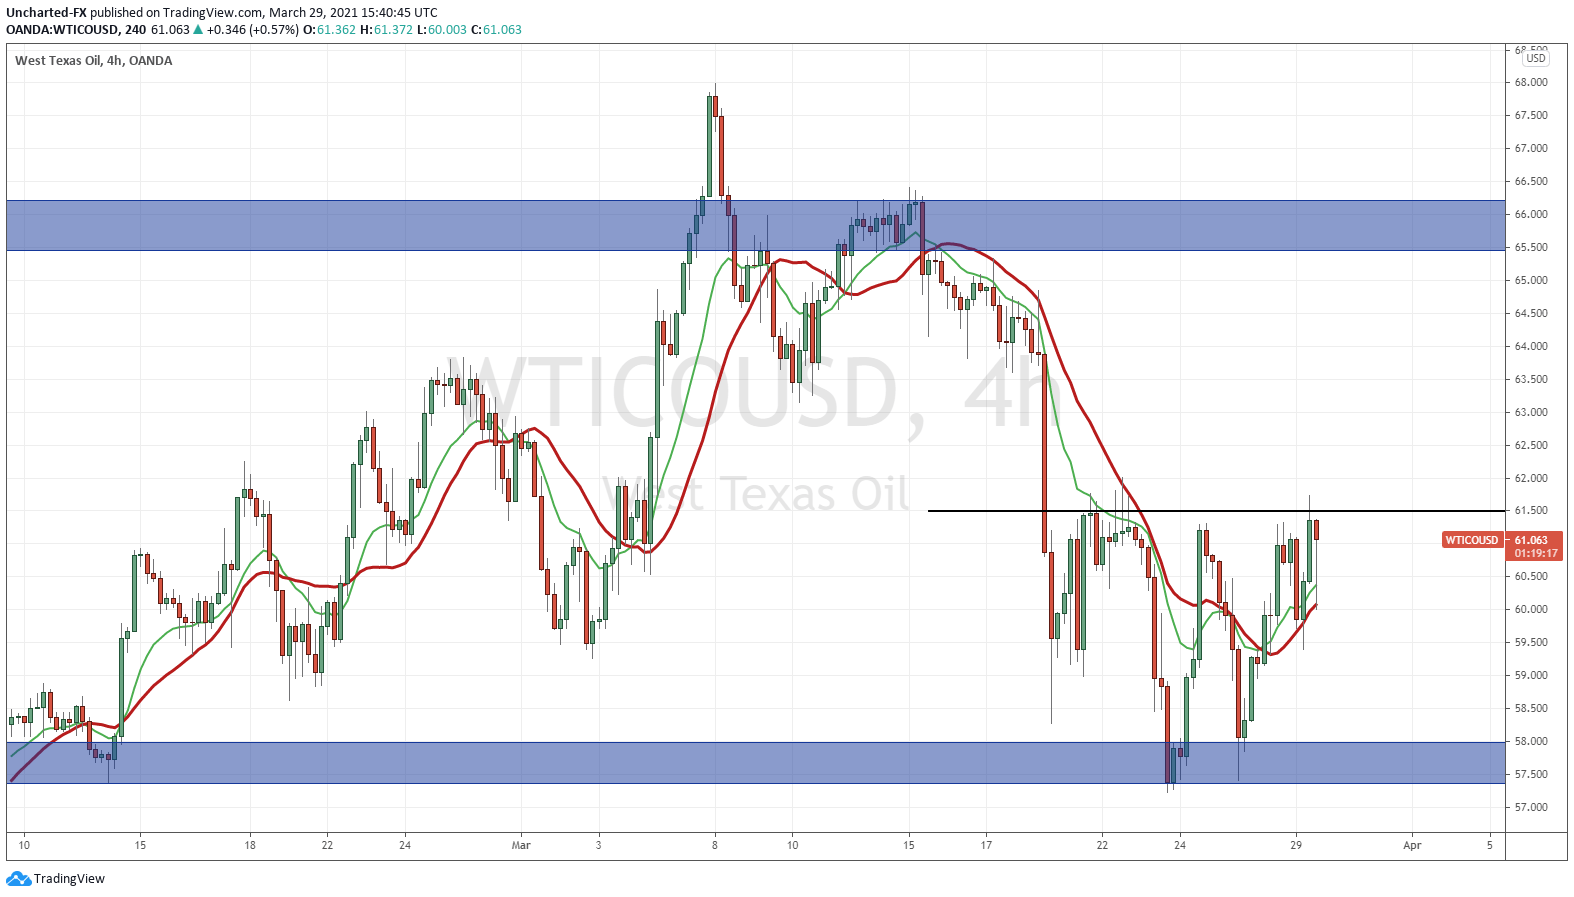
Oil is indicating a bottoming pattern on the 4 hour chart. Our popular double bottom pattern, which essentially looks like the shape of a “W”.
$57.50 to the downside still remains the trigger for the continuation of our head and shoulders reversal, but as mentioned earlier, there just isn’t any momentum. Events occurred which helped prop Oil markets.
For our trigger to the upside, which would then end our bearish stance, we want to see a break and close above $61.50. As you can see from the current candle, a very choppy day which saw Oil tank, but has now received a large bid and has flipped green for the day.
This is the trigger I am waiting for, and what our traders over on Equity Guru’s Discord Trading Room are as well. And if something occurs to prop Oil up…well we will not be too surprised.