
I’d like to say that Fran Lebowitz is my spirit animal, but frankly, that’d probably be demeaning to Fran Lebowitz. The word ‘idol’ better suits. Nevertheless, she is petite and miserable, owns over 10,000 books, is the quintessential New Yorker and says things like “food is an important part of a balanced diet” and “polite conversation is rarely either”.
In an interview for Vanity Fair in 1997 she was asked the question “how do people get rich?”
Her answer was the following:
I started out in life asking this question. Whenever I saw a rich person I would ask where their money was from, and invariably, or should I say inevitably, the answer was a natural resource, or else an unnatural resource. Oil would be a common answer, or real estate, or steel—this was before computers. The answer was never the answer you wanted to hear. The answer was never “Poetry—their money’s from poetry, Fran.” Or “That’s one of the great essay fortunes in this country.” Or “You know, he’s the biggest epigram magnate in Europe.” And so I learned that I was not in the moneymaking end of the moneymaking business.
This truly has little to do with my article other than the act of writing it. As Fran notes, I too, am not in the moneymaking end of the moneymaking business. So, here’s hoping we can collectively learn how to read a stock chart and make our (limited) funds work for us, because vaguely dealing in oil is obviously out of the question.
The first thing to know about charts is that they tell you a story. Is the stock being heavily bought by large investors and fund managers? Does it look like a rollercoaster or a cardiac flatline? Is it bumping its head on the same high? You can literally see the story as it unfolds once you learn how to interpret a few key factors. An investor who doesn’t use charts is the equivalent to an ob/gyn who doesn’t use ultrasounds – which is to say, why go in blind? (please don’t)
1. What’s the trend?
There are only three options. A chart can either have an uptrend, downtrend, or move sideways. A good rule of thumb is to only buy stocks when they are going in the right direction – up. Think, the trend is your friend – don’t fight it (horrible but catchy). Seems obvious, but the problematic nature of human psychology has a tendency to give us a God complex, (especially found in men). That is to say, buying a stock on a downtrend under the presumption that it will shoot up once you buy it, because you and only you have identified a ‘unicorn’ of a stock.
Distilled: thinking that you are somehow special.
Risk, for my writers and artists alike, is already commonplace in our profession so it would be nothing less than idiotic to bring it into our financial universe.
2. What story is the price and volume action telling?
“Volume” in the chart world, probably means exactly what you think it means: the sheer amount of trading happening within a stock. When there is lots of buying and selling going on, the volume is high. And of course, the same goes for the inverse: low volume means less buying and selling.
Volume, as goes with the stock market and just about everything else in the world, is typically dictated by fund managers and large investors. In other words, the rich. This is crucial to understand because it is these institutional investors that have the power to push a stock price visibly higher or lower. The massive amounts of money they manage is too big to hide so you can mark what they are doing by looking for spikes in volume relative to the price.
- If you have been following the delightful horror show that is the GameStop drama, you know that the little guy got sick of following the 1% and a Reddit subgroup, of all things, was able to beat Wall Street at its own game…this reserved for next week’s article.
When the stock price is up significantly and the number of shares traded is well above the average volume, that tells you people are heavily buying in this moment. A high price and volume means that people are typically buying into a story.
In turn, when the trend is down and at an unusually high volume, that tells you that people are aggressively selling.
So, to beat a dead horse, the volume in relation to share price tells you how serious buying or selling actually is. By that transitive property, you also know people’s level of interest in the stock, and how easily you could sell off your shares, in theory.
3. Is the stock finding support or hitting resistance?
When you look at a graph do the squiggly lines seem to be bumping their head at a certain height? Or bouncing off the floor at a certain angle? This is not only important in considering when to buy stock (you obviously would prefer to buy when it is less expensive – but still on an uptrend), as well as an indicator that the trend is solid and won’t, for lack of a better phrase, fuck you over.
If you look at the 5-year chart of a utility company, say BC Hydro, it probably follows a shallow (slow, small and steady) uptrend. However, within this you may find seasonal trends – like the stock always dipping in July, for instance. As an investor, you can use these patterns as an indicator of when to buy. Mining is a seasonal industry for example (hard to dig into frozen ground).
A good way to visualize this is to use…
Definition!
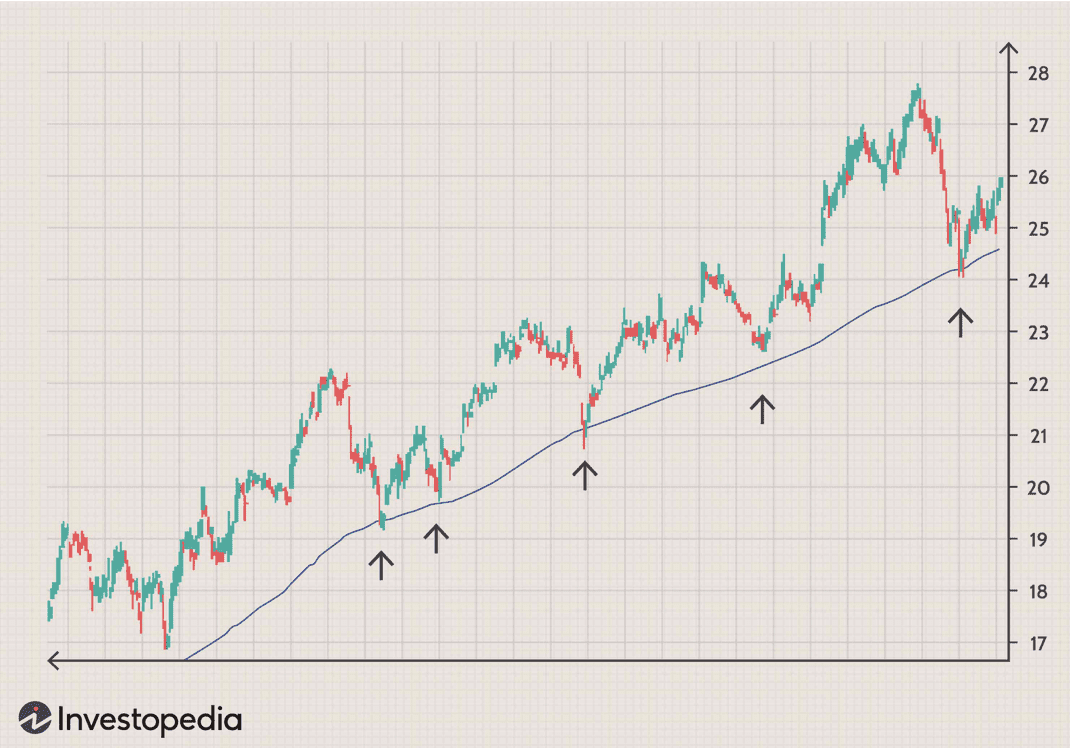
Moving Average (MA): A line drawn on a chart used to track and identify trends by smoothing normal day-to-day price fluctuations. There are various moving average lengths (i.e. 50100, 200 days). Investors can use this as a support or resistance level indicator and base trades around it. This graph shows a floor of support (the price bounces up off it), whereas in a downtrend, a moving average may act as a ceiling of resistance (the price hits the level and starts to drop again).
If a stock is able to punch through a moving average line, it may be time to worry or buy more (dependent on the punching direction). An aside: I am linking the video I watched for this info – click if you want to feel like you are a 1950s teen in math class.
Disclaimer: No matter how beautiful a chart looks, when looking at the past performance of a stock – of most anything really – you can’t just assume you will get the same going forward. Similarly, to a first date. Just because there were no immediate red flags does not mean you won’t later discover they have lithophilia. (To your discretion whether you want to look that one up).
But generally, if you get a good vibe from someone after a few outings, you can feel pretty confident that they are not out to Hannibal Lecter you (at the very least).
The same goes for a company chart. If they seem solid all the way through, it is relatively unlikely that something catastrophic will emerge. And either way – at least you did your due diligence.
But no guarantees. Which is what makes life so exciting, no?
As Fran says,
There is no such thing as inner peace. There is only nervousness or death. Any attempt to prove otherwise constitutes unacceptable behavior.
To being witty, nervous and miserable…
Until next week.