
Bitcoin was down over 20% at one point yesterday as the cryptocurrency had one of its largest two day price plunge. 200 Billion was wiped out on the cryptocurrency market. Many of the Gold bugs are reminding the Bitcoin bulls who invest in the cryptocurrency as a safe haven, that safe havens should not be moving like this. One of the rules that I abide by in my trading is to not give in the fear of missing out (FOMO). If you feel like you are missing out, you have missed out. Don’t chase things. It is a rule which has helped me remain in this game for this long.
Just looking at the price of Bitcoin, one could ascertain that a pullback was due. Sure, nobody can tell you if price pulls back right away, or if the momentum carries price higher before pulling back, but we must remain patient, not give into the FOMO, and await for reversal signals.
Members of Equity Guru’s Free Discord Trading Room were warned about a reversal pattern in Bitcoin on Sunday. A pullback. Members of our group, and my readers know my principles for market structure. All assets and markets move in three ways: an uptrend, a range, and a downtrend. That’s it. Our job as traders and even investors on the higher timeframes, is to await signs of a reversal to either enter a position, or conversely, to sell a position or go short.
When an asset such as Bitcoin has been in a strong uptrend for weeks, we should expect a pullback because nothing moves up in a straight line forever. What would cause a pullback? There could be some fundamentals such as news and such, but the most obvious reason is that people are taking profits.
So let me guide you through how I called the reversal on Bitcoin. This market structure pattern and principles can be used to trade anything with a chart be it stocks, indices, bonds, commodities, junior miners etc.
First of all it should be mentioned that I look mostly at the 4 hour charts, meaning every 4 hours throughout the day, I will open up my charts and go through my watchlist which composes mostly of indices, forex pairs, commodities and crypto’s.
So remember our market structure principles? Well the 4 hour chart has been in a strong uptrend. I do not want to overly complicate this post, but uptrends and downtrends are composed of things we call swings. In an uptrend it is called a higher low. For downtrends we call them lower highs. In layman terms, when price is in a trend it does not go up in a straight line. Price tends to move higher and then pullback and then continue higher and this continues until the trend is losing steam. This is key because by definition, a trend is still valid until its previous swing gets taken out. By this I mean a candle break and close either above or below the swing depending on the trend.
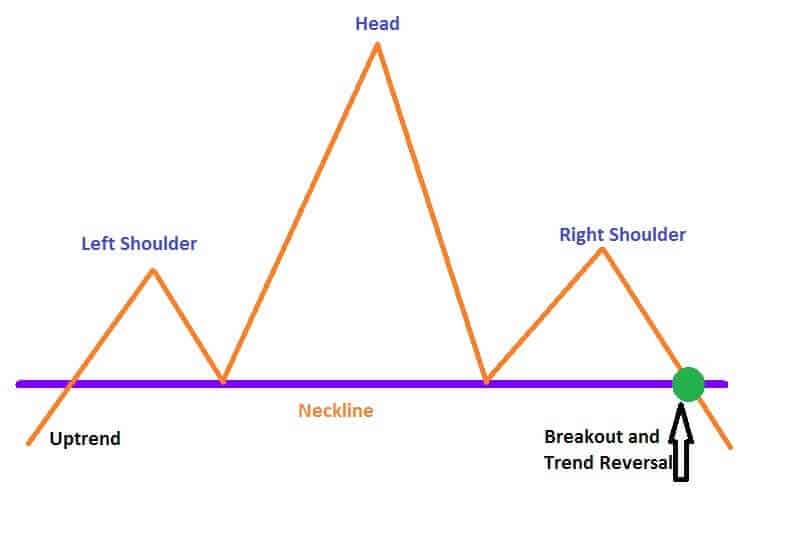
Now back to the chart. There are three type of reversal patterns that I look for. Head and shoulders and the double top are the quintessential reversal patterns. Study them, and they should be in every trader’s toolkit. Many of my Market Moment posts and Discord posts use these patterns to call for reversals after a prolonged trend. The third way price shows signs of a trend exhaustion and a potential reversal is through a range.
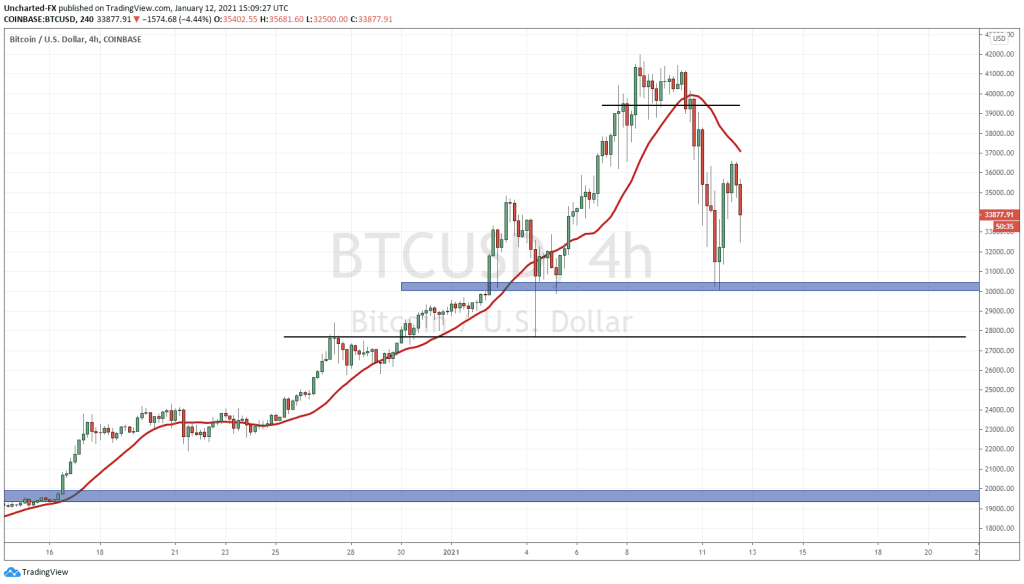
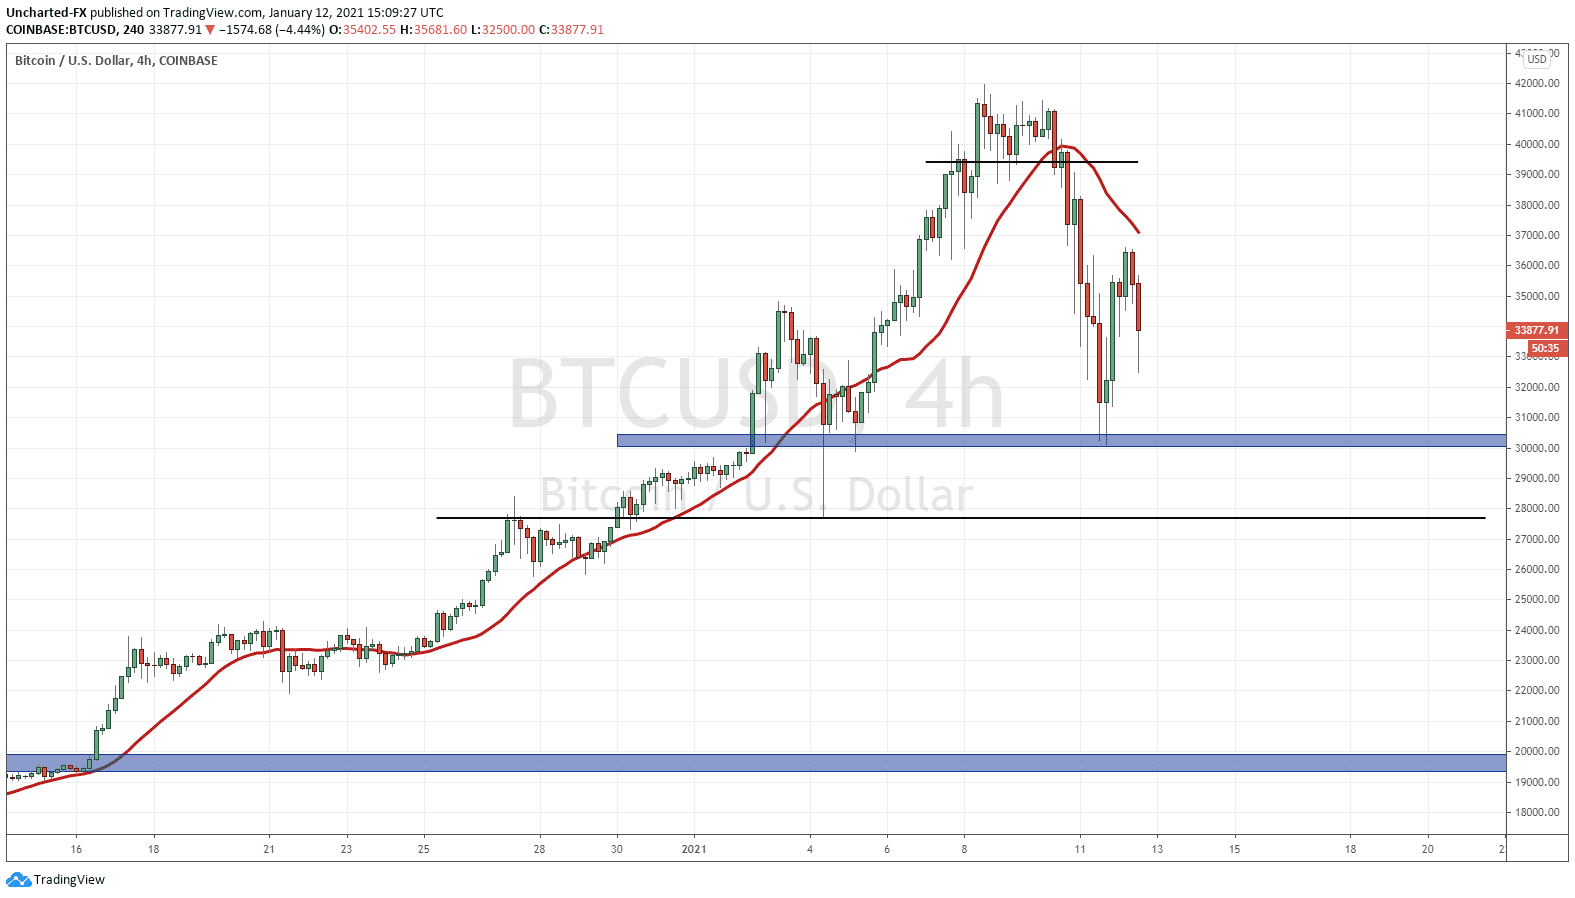
What is a range? Very simply a rectangle. Price remains between two zones for a very long time and creates a consolidation pattern and remains flat. Just looking at the chart you can see we actually did form some ranges in the past. But the key to a range is price MUST break and close below the bottom limits of the range. Which takes us to the reversal, and to the very top of my chart.
I spotted a range with the bottom limit of my support at the 39450 zone. Price then broke and closed below it but the key was the retest. This confirmed the reversal. Notice how price climbed back above before then dumping with a huge red candle. That is called a retest confirmation. Something we see in many charts. Breakouts tend to eventually retrace back to their breakout zones before continuing the trend… more on this later.
Once we have the break, we need to look for next targets. I told our members that I was targeting the 31k zone. As you can see from the charts, it was a previous support zone (price floor). And in fact, bidders stepped in. BUT I do not think this pullback is done.
Before I discuss what I think comes next, let’s quickly highlight the bullish case purely on a technical basis. If Bitcoin price climbs back above 39450 and confirms a candle close, the downtrend is nullified and we continue higher.
However, it appears that another swing low is coming. Notice how price popped from our 31k support before rolling over. For those with a keen technical pattern eye, you can see what looks to be a wider head and shoulders pattern with the right shoulder being formed currently, and our neckline at 31k.
In terms of the next target, I will be watching the 27630 zone. Why? Because technically, this is the flip zone on the 4 hour chart. A flip zone is an area that has been BOTH support and resistance in the past. My black line indicates the support and resistance touches. Will be watching this zone closely.
Now I am not saying this will happen, but ideally, I would like Bitcoin price to pullback to 20,000.
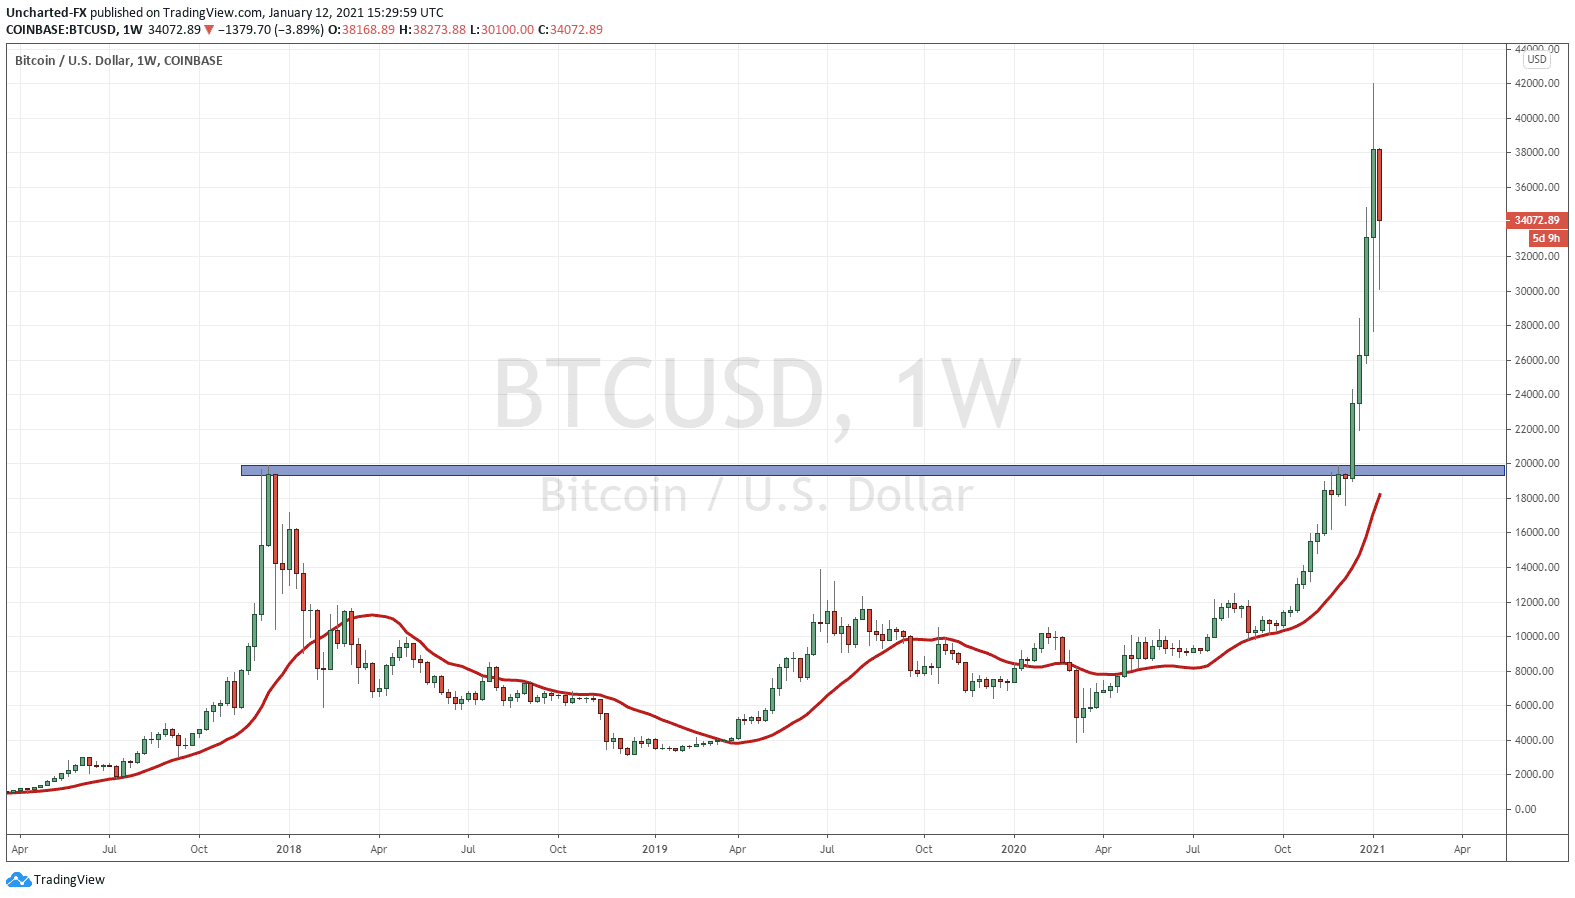
Remember the bit I mentioned about price eventually retesting previous breakout zones before continuing the trend? Well this would mean Bitcoin will have to retest the 20k breakout zone. Would love for it to happen in this pullback.
To me it is just normal market structure, but a lot will be said about what some call a safe haven pulling back 50% from its highs in, what could be, a short amount of time.
If and when Bitcoin retests 20k, I would be a buyer at that level depending on whether I see signs of the bulls defending the zone. My case for crypto’s is still the run out of fiat money. More crazy monetary and fiscal policies are incoming to combat Covid. Central banks are in a currency war. All of them are trying to weaken their currencies to boost inflation and exports. Negative rates, and in some cases, more deeper negative rates, are coming. By the way, this likely means a centralized digital currency. One could argue the move into Bitcoin and other cryptocurrencies is frontrunning this, as decentralized crypto’s will be ways to hide your money from governments.
I know the Gold bulls and the Bitcoin bulls debate about which is better, but can’t we all get along? I like and own both because they both meet the purpose of getting your money out of fiat. Gold is a commodity (really money through the eyes of classical economists), and commodities are where you want to be going forward, just look at the Bloomberg Commodity Index. Whereas Bitcoin could be ‘gold’ in a new central bank digital currency world as the way to hide your money.
Fair warning: if Bitcoin prices move higher, eventually the central banks will not ignore it. Regulations will be imposed. Just yesterday the UK’s Financial Conduct Authority (FCA) called crypto’s very risky and that investor’s should be “prepared to lose all their money”. Of course they were addressing the speculative nature of these assets, but ‘the man’ is starting to pay attention.