
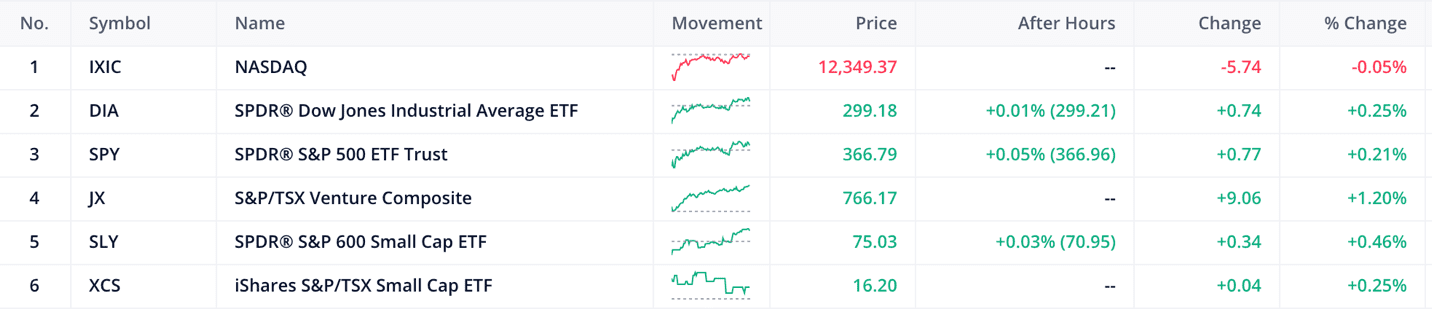
- The S&P 600 are up by 0.46% and TSX20 is up by 0.25%
- The Canadian 10-year bond up by 0.02% and the US 10-year bond down by 0.00%
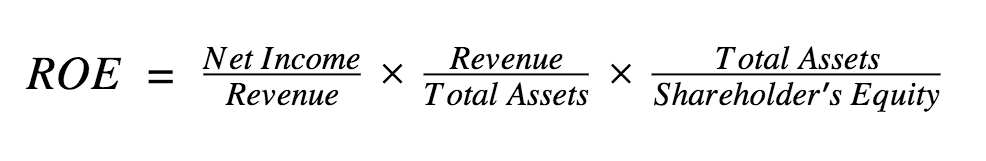
Return on equity measures the return earned by a company on its equity capital including minority interests, preferred equity, and common equity. This financial metric is important on its own, but when it is integrated with other financial ratios it sheds light on the effectiveness of management teams to return money to their shareholders.
To understand what drives a company’s ROE, a useful technique is to decompose return on equity into component parts. This is known in equity analysis as the DuPont model. This method was popularized by the Dupont corporation an American company formed by the merger of Dow Chemical and E. I. du Pont de Nemours and Company on August 31, 2017, and the subsequent spinoffs of Dow Inc. and Corteva.
The three major financial metrics that drive return on equity (ROE) are operating efficiency, asset use efficiency, and financial leverage.
From the financial ratios above many analysts have taken it a step further adding more information from the financials as can be seen below.
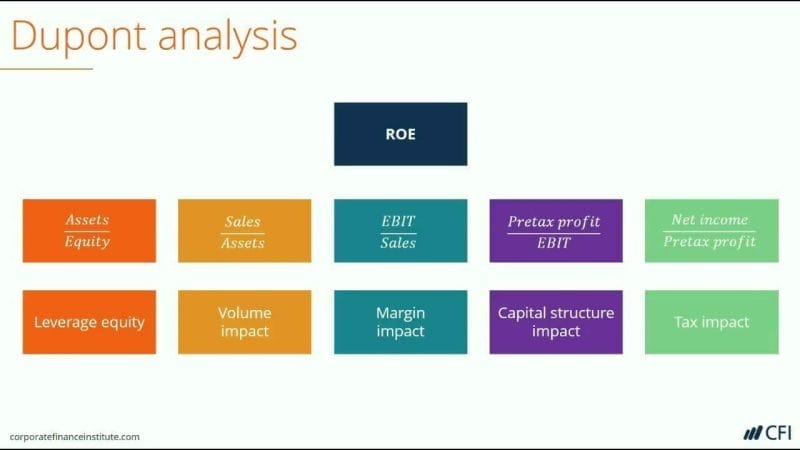
This version of the model is the most popular one and the one we will use for our live case of the Canadian financial banking system.
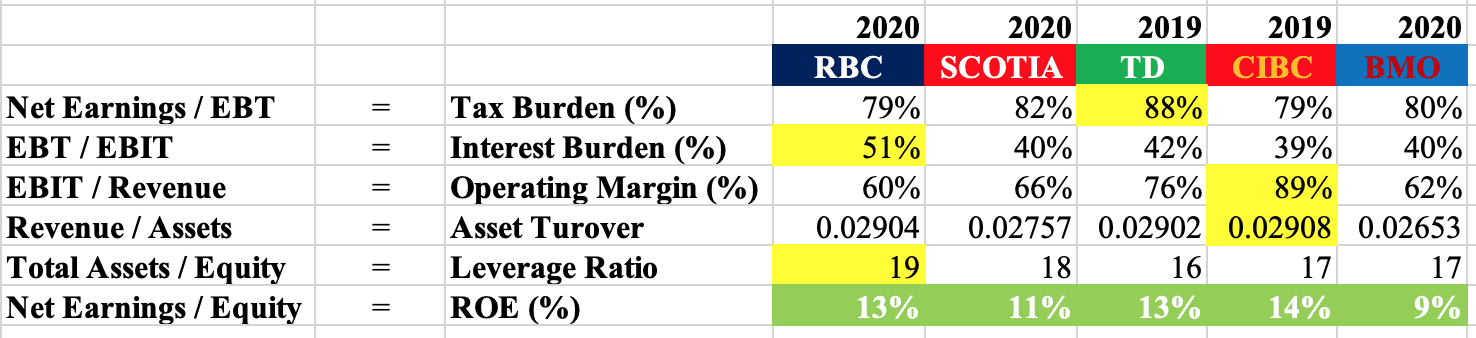
Our starting point for today will be the tax impact or burden percentage. As it says in the name this is the impact of taxes on the company’s earnings. This can be found by calculating the post-tax earnings and dividing by the earnings before tax.
A number closer to 100% means the business is retaining 100% of the earnings net of taxes. This is obviously unrealistic as any business conducting commercial operations in any jurisdiction has a duty to pay its taxes due. But a number closer to 100% can be seen as favorable.
Of the big 5 banks, Toronto-Dominion Bank (TD.TSX) Has a tax burden percentage of 88%, which is the highest. Whilst the Royal Bank of Canada (RY.TSX) and Canadian Imperial Bank of Commerce (CM-Y.TSX) have the lowest tax burden percentage.
This can mean many things. TD might have better tax management or more beneficial tax credits and subsidies from the federal or state tax authorities. Since all banks follow the same/similar reporting and auditing we assume the tax code is the same for each bank and management is the difference between the firms.
Going down the table we have the financial impact or interest burden. This is calculated by taking the earnings before tax and dividing by the earnings before tax and interest. As with the tax burden, a number closer to 100% is better. But it should be noted that the banking industry might be in a situation where the interest burden calculated due to accounting policies might be a little off. This is because in banking part of the interest expenses is interest paid on interest-bearing deposits. When we look at the interest burden what we are looking for is the interest impact by using financial leverage in the means of debt or loans and not deposits or insurance premiums.
So, in this case, the analyst can either ignore or adjust the numbers appropriately.
We won’t take much time talking about operating margins, because it is a really popular measure of financial efficiency by itself. It’s usually used as a metric to quantify the efficiency of the day-to-day operations of the business. Usually, a higher operating margin means management is able to manage working capital and https://e4njohordzs.exactdn.com/wp-content/uploads/2021/10/tnw8sVO3j-2.pngistrative expenses effectively.
Continuing with the analysis we now have the asset turnover ratio. This is one of the measures in finance that is used to see how effective management is in utilizing investable assets to generate sales. The calculation is done by taking the total sales in a given year divided by the average assets. Banks usually have very large asset positions because of a large loan portfolio or cash and cash equivalents from their investing operations.
In this case, all banks are essentially the same and CIBC has a slight edge, but with time as the asset base grows and it becomes more difficult to generate revenue, we can assume the asset turnover for CIBC will decrease.
Lastly, we have the leverage ratio or the equity multiplier. This is a common measure of borrowing capacity. It is common knowledge that the more you borrow whilst putting an adequate amount of equity capital by yourself the greater your return by using borrowed money. This is if you’re able to keep your interest payments lower than your total return on invested capital.
RBC has the highest equity multiplayer, and this is reflected in their higher return on equity, although they are the least efficient when it comes to operating margins. But it’s important to note that they also have the highest interest burden capacity meaning they are able to pay off their fixed charges and take on additional debt capacity.
The most significant disadvantage of the DuPont model is that, while extensive, it still relies on accounting equations and data that can be manipulated and exploited by auditors and management teams. Plus, even with its richness, the Dupont model lacks context as to why the individual ratios are at certain levels, or even whether they should be considered good or bad.
The only way to counter this is by a keen understanding of the industry, the business being analyzed, the market conditions being invested in, the stage of the business cycle the economy is in, and the investors’ circle of competence and experience.
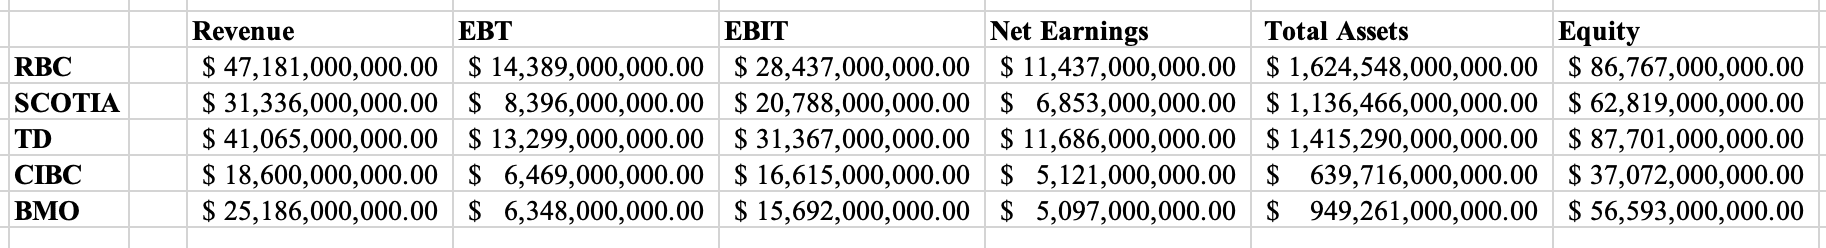
Raw data
HAPPY HUNTING!
Legal Disclaimer

The information on this article/website and resources available or download through this website is not intended as and shall not be understood or constructed as financial advice. I am not an attorney, accountant, or financial advisor, nor am I holding myself out to be, and the information contained on the website or in the articles is not a substitute for financial advice from a professional who is aware of the facts and circumstances of your individual situation.
We have done our best to ensure that the information provided in the articles/website and the resources available for download are accurate and provide valuable information for education purposes. Regardless of anything to the contrary, nothing available on or through this website/article should be understood as a recommendation that you should consult with a financial professional to address our information. The Company expressly recommends that you seek advice from a professional.