
Lot of action so far this morning. From Greenwich Lifesciences popping over 2000% on upbeat Breast Cancer Treatment, to the European Central Bank increasing their emergency bond purchasing program to 1.85 Trillion (yes, Trillion, not Billions), to the anticipation of DoorDash’s first full day of trading, Brexit drama, and finally, US Jobless claims coming in at three month highs.
There was a point a month ago where US jobless claims were reducing per week, mind you they still stayed above 700k per week. Then we got a data print which broke that pattern, and analysts were fearing a second round of layoffs. That seems to be the case as US jobless claims for the week came in at 853,000 vs 725,000 expected, highest level since mid September and blowing past analyst expectations.
Not to mention the ongoing drama of Congress passing a new stimulus bill, when millions of Americans will lose aid by the end of the month. Talks started off positively at the beginning of the week, but then things quickly turned sour when it came out that the Democrats found the cutting of the $300 a week jobless benefit unacceptable.
This news led to lower markets yesterday, and the drop continued this morning.
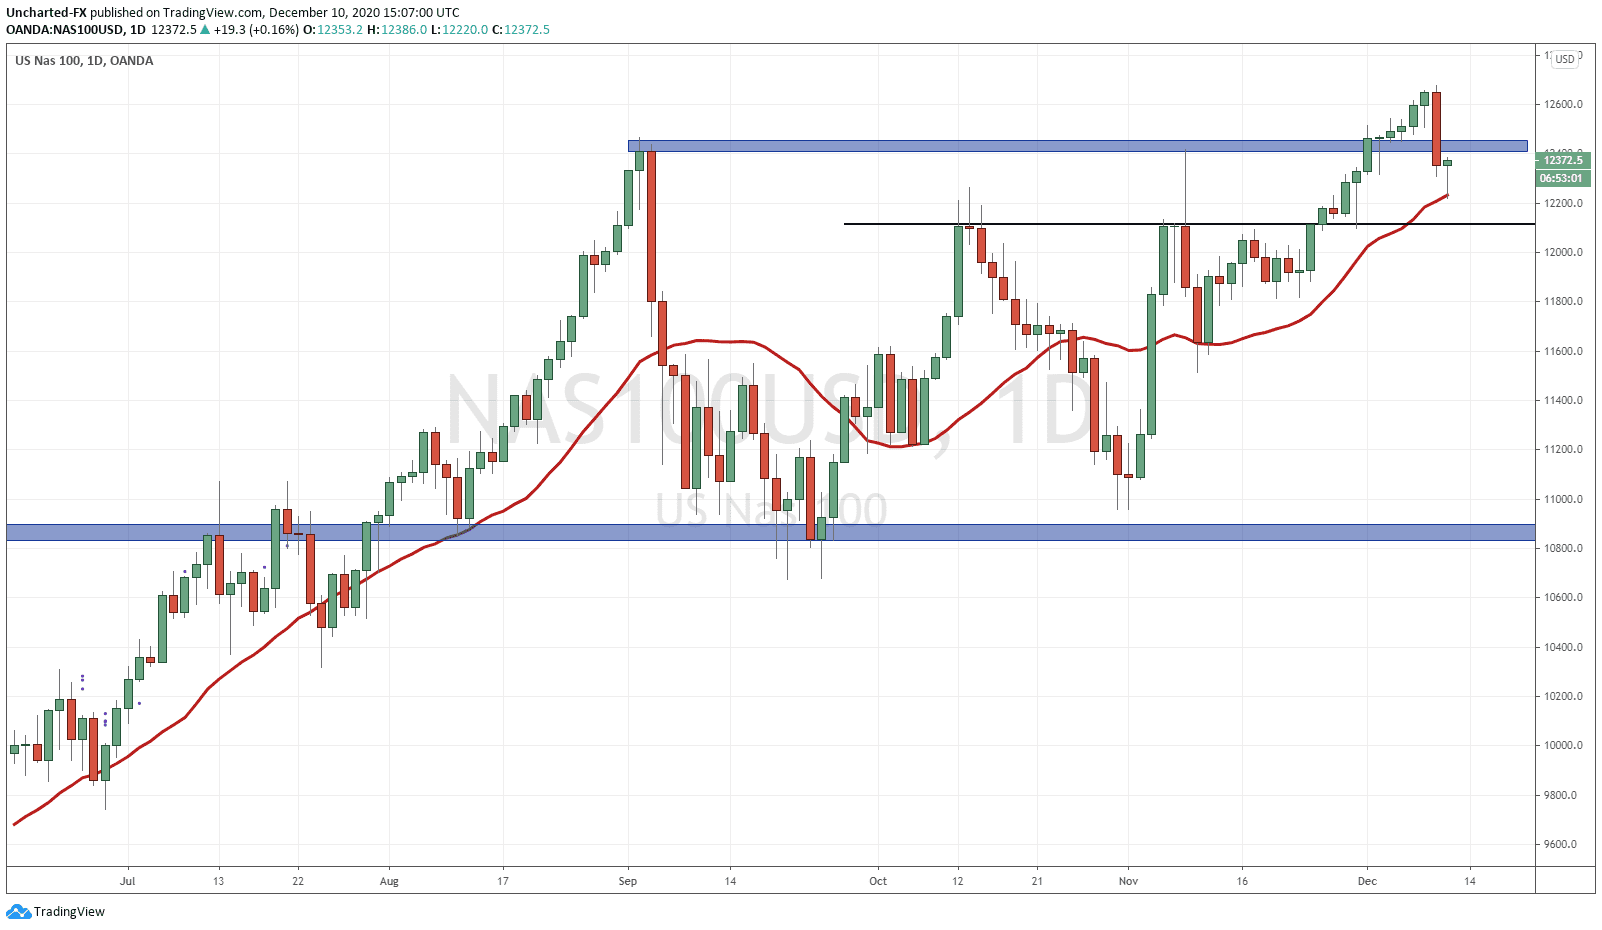
The Nasdaq confirmed a daily close below support (price floor) yesterday. A big engulfing candle that gobbled up almost 6 previous days of price action. A very strong move lower.
According to market structure, and something my readers are familiar with now, when price breaks down what was once support (price floor) now becomes resistance (price ceiling). Price tends to retest resistance before continuing lower.
Currently, the Nasdaq has flipped green but we would want to see the daily candle close back above what is now resistance. Right now, it is retesting and remains possible that sellers jump in to drive the Nasdaq lower.
If the Nasdaq gets its close back above, the chance of a downtrend diminishes greatly. This would point to profit taking at record highs before buying back the dip. Today’s daily close will be very important.
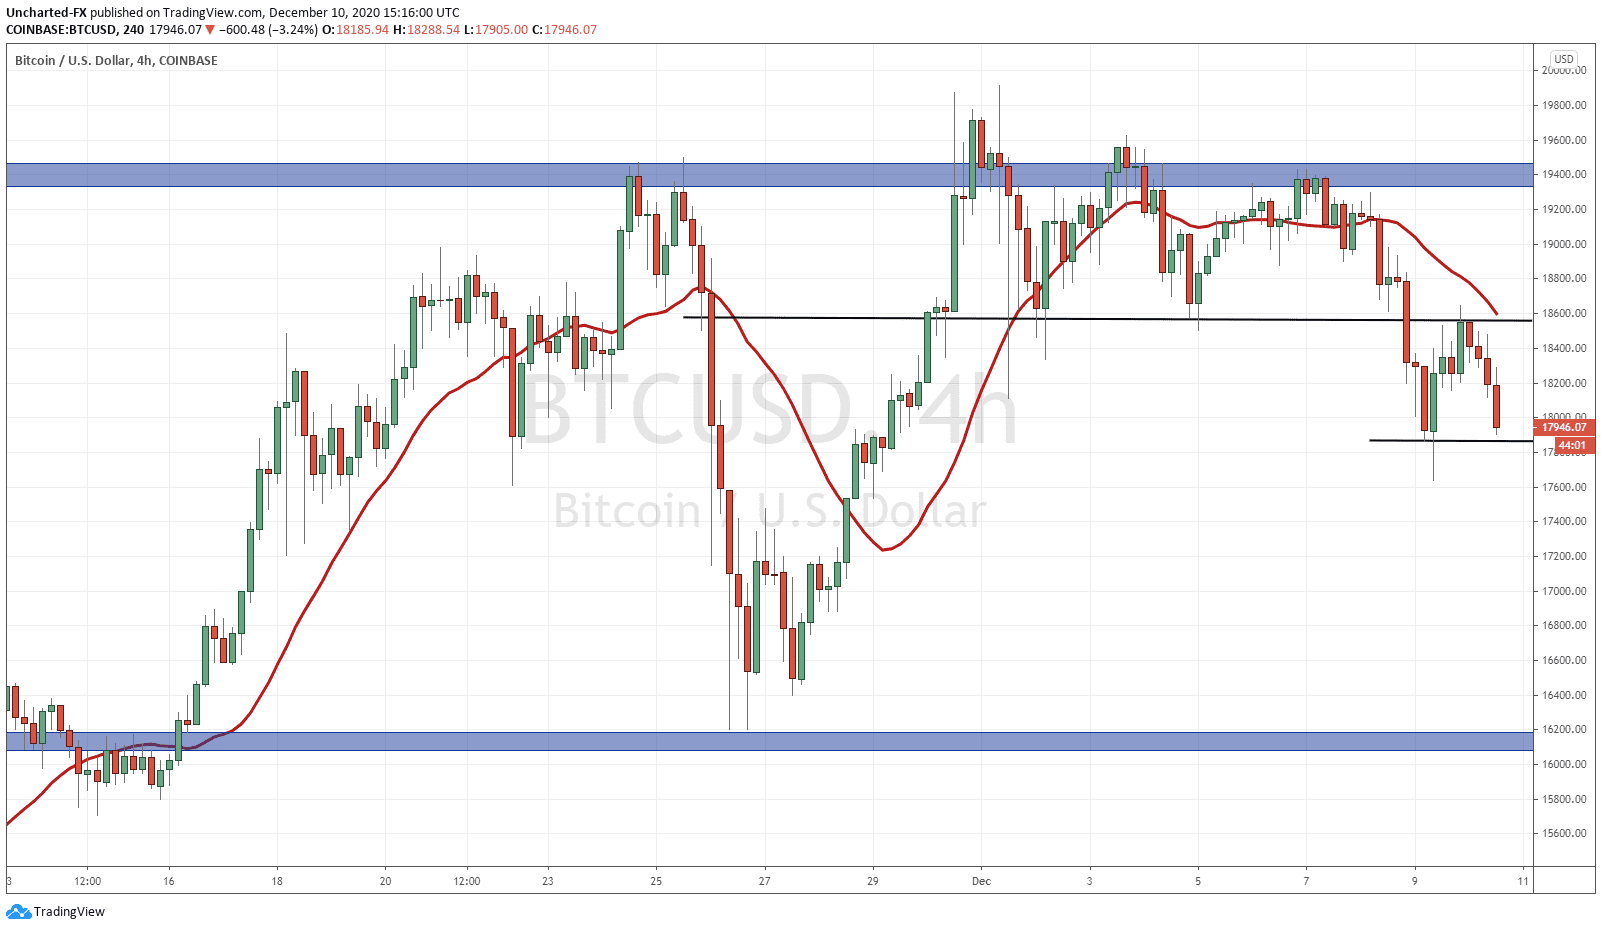
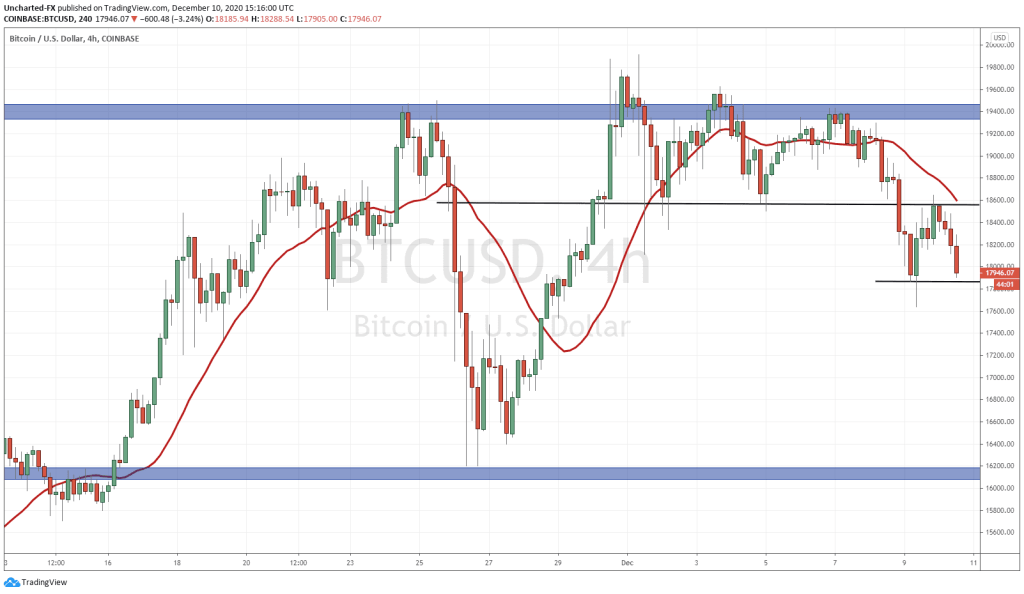
Bitcoin is a chart that presents a good analysis of what can happen when price breaks and retests. This is one that I have mentioned to our members over on Equity Guru’s Discord Trading Room. The breakdown occurred on Sunday.
18,600 was our support zone and Bitcoin began consolidating at a resistance zone, but not any old resistance zone. It was previous all time record highs. The momentum never carried us forward, and we began to range/consolidate. This is very important when we are in an uptrend and begin to consolidate at resistance.
Breakdown eventually happened and as you can see, price pulled back to retest the breakdown zone…just as the Nasdaq is currently.
On the Bitcoin side, we did not break back above to invalidate the downtrend, and instead rolled over. The retest was successful.
In technical terms, this is called a lower high swing. Just means we have another leg lower. We are bearish as long as price remains below 18600.
Target would be the 16200-16400 zone. If you are not already short, I would await for a break here below 17850. Keep in mind that the US Dollar has dropped significantly today but so far, not helping to prop up Bitcoin…or even Gold for that matter.