

Value is what you get, and the price is what you pay, investing is not about watching the price but appraising the value and paying a fair and appropriate price.
This can only be true if we define investing as an operation where through thorough analysis, promises the safety of the principal and a satisfactory return. Operations not meeting these requirements are speculative.
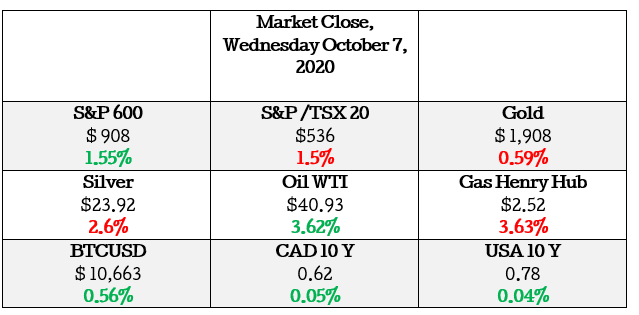
Market Movers
Today we the judges have picked: Sarama Resources as an “attractive common stock”
This move was due to the reverse stock split that was in effect as of today, the new shares have been consolidation and one new share today is worth 3 of the older shares of Sarama Resources.
Reverse splits are not as common as a straight stock split and as we have discussed before they are usually done for a few reasons, these being:
- increasing the price of the outstanding common stock to avoid being delisted from the stock exchange or
- as a way of gaining more respectability in the market from a higher stock price.
Although the number of outstanding shares decreases and the price per share increases, the market capitalization (and the value of the company) does not change. As a result, reverse splits allow companies to avoid delisting if their stock price is too low whilst fundamentally retaining their value.
Sarama Resources 1:3 share rollback
2020-10-05 17:25 ET – Rollback
Pursuant to a director’s resolution passed Sept. 29, 2020, the company has consolidated its capital on a one-new-for-three-old basis. The name of the company has not been changed. Effective at the opening on Oct. 7, 2020, the common shares of Sarama Resources Ltd. will commence trading on the TSX Venture Exchange on a consolidated basis. The company is classified as a mineral exploration/development company.
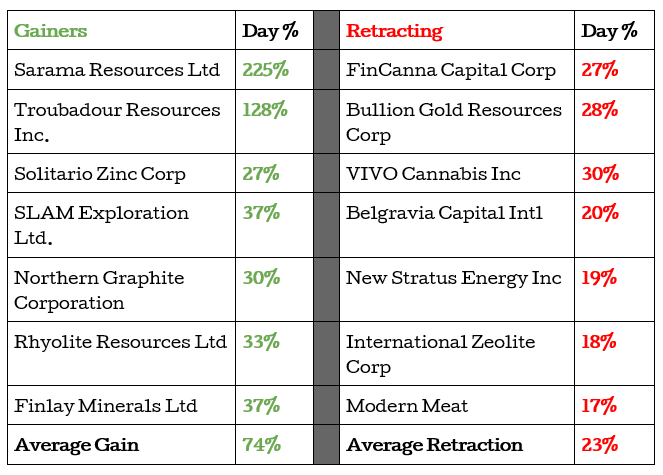
I usually post the table above at the end of the week as a sort of rundown of how the markets have played out on that particular day. But today I just could not ignore the 51% price change deferential between the gainers and “losers” of the day.
This is obviously very bullish sentiment and could mean the market could be a little overheated.
Is Market Overvalued? And Why this is important for Investors.
The Equity.Guru team has been asked this very question several times over the last few weeks pertaining to the market being overvalued and what investors should be doing with their life savings.
This has been especially persistent in many people’s minds because of the cheap money that is flowing into the general economy from the government stimulus package. On that note, there is general confidence in the market today by US “investors” that a new bill might go through the house, etc. This kind of optimism pushed US equities higher for the day.
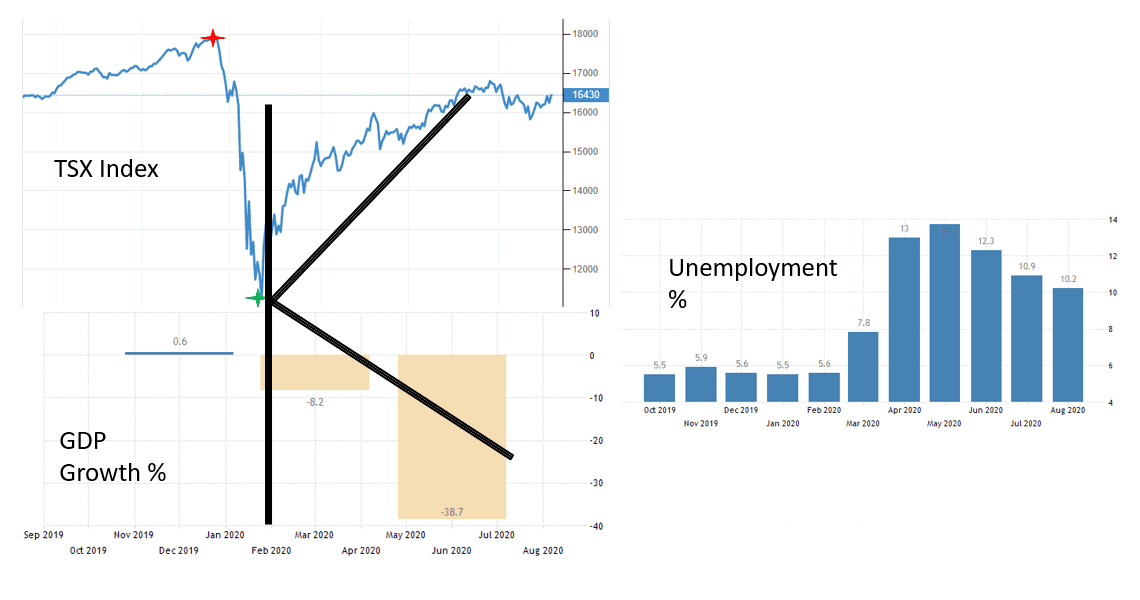
There are concerns that this cheap money has caused a K-Shaped recovery and the reality of the depression in the economy has not been proportionately priced into the general stock market.
Unemployment in Canada is in a range that we have not seen since The Great Depression and one-third of the economy has shut down due to COVID 19 and as coronavirus cases continue to increase there are talks about a second shutdown looming.
How can the investor look at this and still be willing to buy stocks at what seems like high prices amid a global pandemic?
The two important things for investors to always factor before deploying their capital are
- The price you pay for each dollar of earnings from the asset
- and what you are paying for, or better said the value of the asset.
How can the causal investor know if we are in an overheated market? The easy answer would be to see how many of your neighbors, family & friends have bought into the hot stocks and believe no price is too high. This is a healthy indicator of a possibly unhealthy stock market.
The more difficult approach needs a little bit of digging but can save any investor from losing their hard-earned cash.
The first step is to see how much you will need to pay to take part in a dollar of the earning of the general market. We will use the S&P 500 Index as the “best” measure of the general stock market for large companies and the S&P 600 as the yardstick for mid and small-cap companies.
To put this into perspective the S&P 500 is worth 27 Trillion USD that is about 158% of the United States Gross Domestic Product(this is the economy’s ability to produce new goods and services). The S&P 600 on the other hand is about 4% of the GDP.
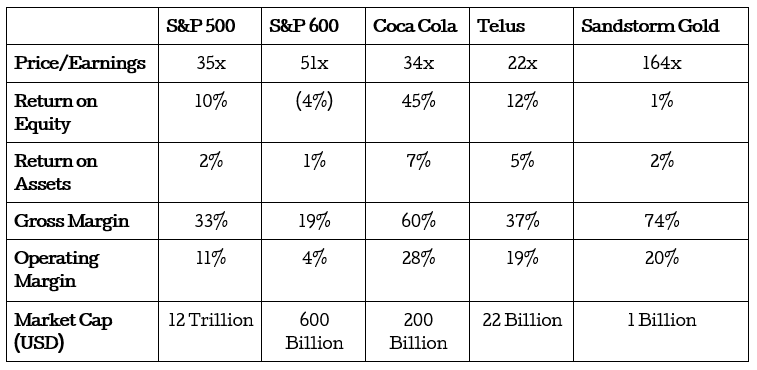
If we were to buy the S&P today we would buy it at a P/E ratio of 35x earnings. This means you pay $35 to get $1 of earnings from the S&P 500. How much can we expect these earnings to grow over time? Easy, the return on shareholders equity gives us as a percentage the return a shareholder (ROE) can expect from their investment, assuming all earnings are paid out as dividends. The S&P 500 has an ROE of 10% meaning that we pay $35 dollars per share and expect the return on each dollar of earnings to be about 10%.
The second step would be the value we would get from the S&P 500 at current prices. The simplest way to know if what you own is of value in economics is by quantifying the efficiency of the asset. For example, we would rather have an equity.guru lemonade stand that made $1 of revenue and kept 40 cents as profits after what it costs to make the lemonade and then kept another 20 cents of that revenue after paying your water bills than a lemonade stand that kept only 20 cents as profits after what it costs to make the lemonade and then kept another 10 cents of that revenue after paying your water bills.
In accounting the financial ratios that give us these two measures of profitability are Gross Profit Margin(GM) and operating margins(OPM). Generally the higher the percentage the more efficient the asset is. The S&P 500 has a GM of 33% and OPM of 11% and compared to the S&P 600 is more efficient when it comes to retaining profits and managing costs.
This is one of many ways the investor can quickly access the value of the asset if it is a business. I have also added the numbers for Coco-Cola (KO.NY), Telus(T.T), and Sandstorm Gold(SSL.T) for those curious readers who want to take their analysis deeper.
Now that we know the S&P 500 is a valuable asset is the current market price we are paying appropriate?
We will need to use a third-party source to get a history of the P/E ratio for the S&P 500. The are many websites where the investor can access this data and the one I used produced these measures of central tendency for the P/E ratio from 1880 till 2020.
Average: 15x
Median: 14x
Minimum: 5x ( in 1920)
Maximum: 44x (in 1999)
On average when things are normal the S&P 500 trades between 14x to 15x P/E and has been as high as 44x in 1999 around the time of the dotcom bubble. Coincidence? I think not!
From this, we can assume that at current levels a P/E of 35x might be a little too high indicating to the intelligent investor that the general stock market might be overvalued.
This is not to say that there is no point in looking for investments, on the contrary, this is the best moment to be looking for those businesses that are being forgotten by investors right now like the financials(banks & insurance companies) because they aren’t as exciting as the technology sector.
S&P 500 Financials : P/E of 17x
S&P 100 Information Technology : P/E of 33x
But again, this is merely a guess. The reality of the beauty contest is that if every stock is somebody’s favorite, then every price should be viewed with skepticism.
HAPPY HUNTING!