
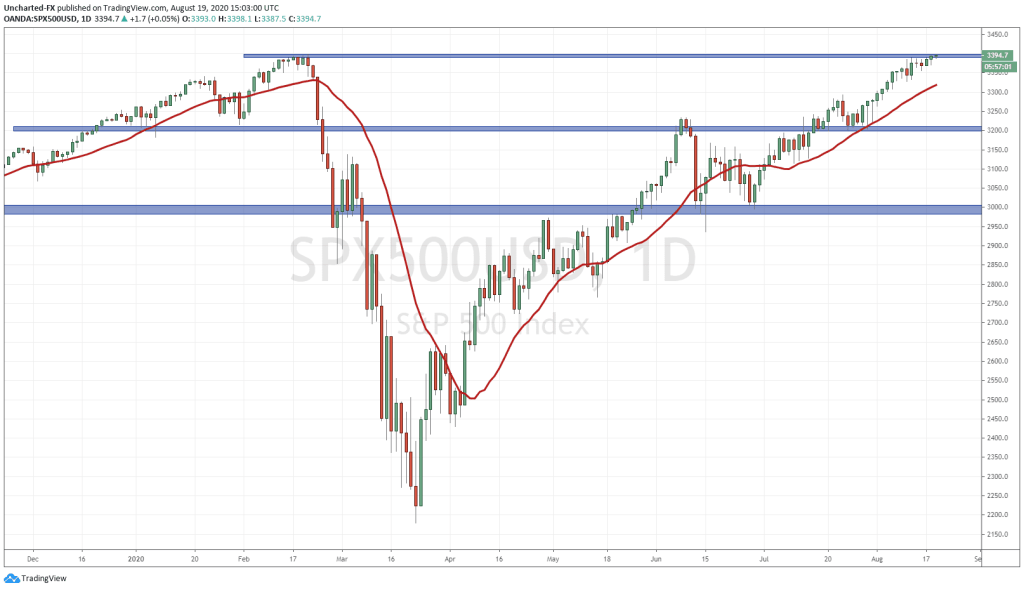
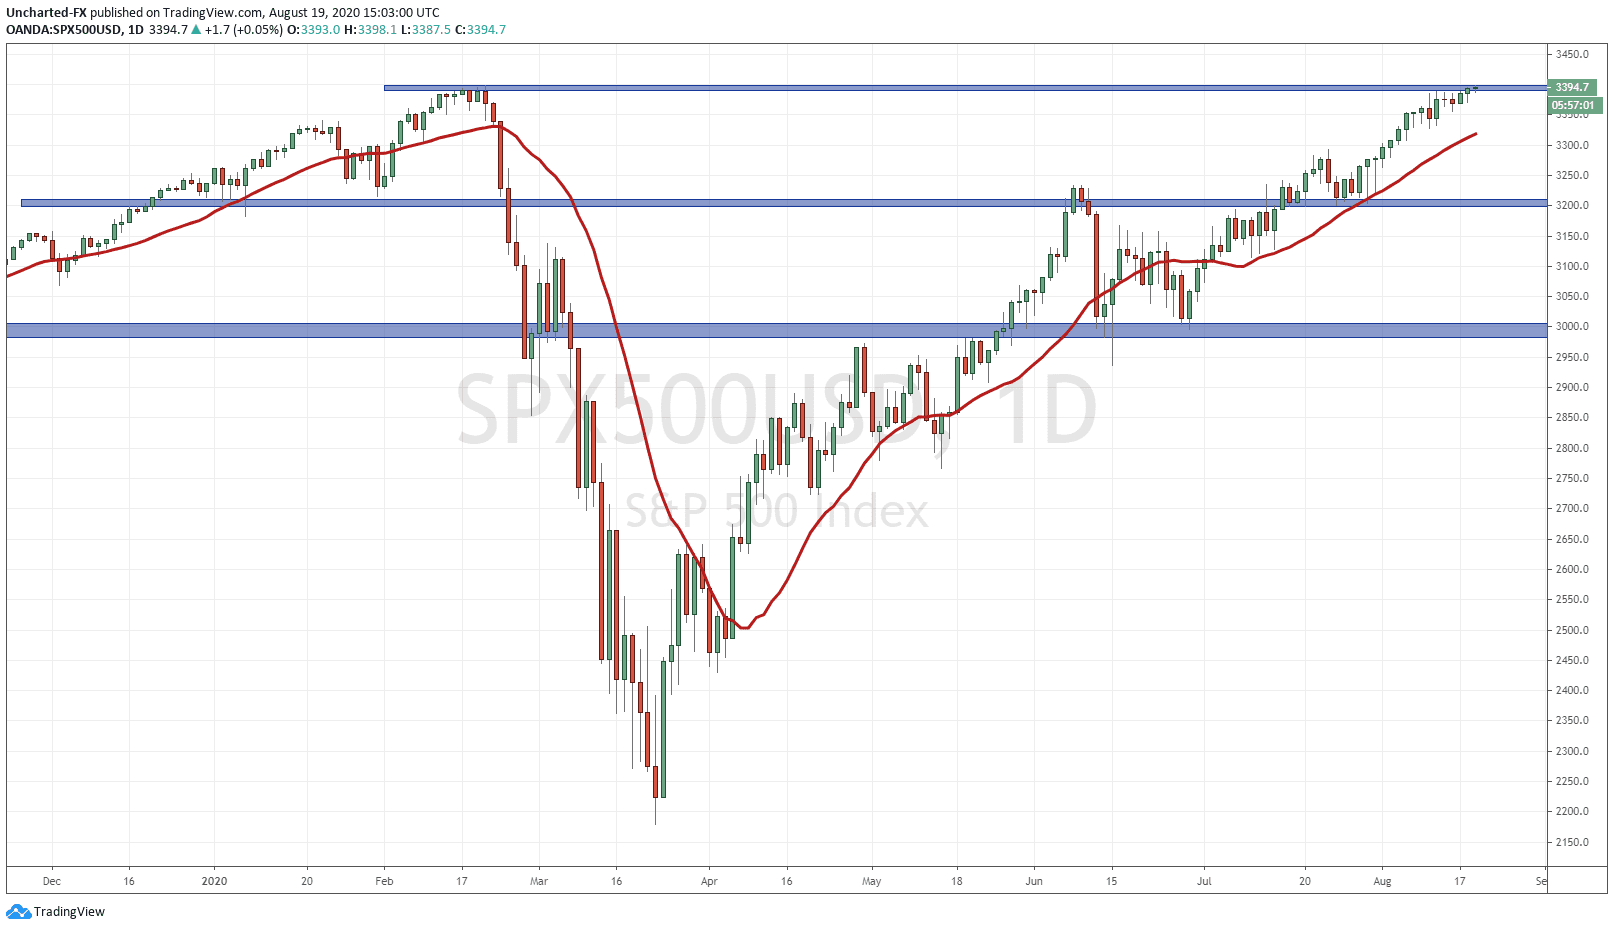
We made three new records yesterday on a historic trading day. The first was the S&P 500 making a new record close. The second was the Nasdaq making new record highs (this just never seems to end!). While the third went under the radar for most parts, but is significant. The final record was that this was the end of the shortest bear market EVER. With the record close on the S&P 500, we are now officially in a new BULL market. My readers have known the game: markets will move higher on a hunt for yield. More cheap money and suppressed interest rates means stocks are the only place to go for real yield. There is a disconnect between the real economy and the stock market economy.
There is a chance that markets will go parabolic. If the vaccine news is not priced in like the big banks say, then this will see money that was on the sidelines, enter these markets. If Joe Biden wins the elections, it would be stock market positive. Biden and the Democrats means more cheap money as programs and benefits would expand. Finally, there is a possibility that foreign money around the world will want to chase gains in the US markets. Asian markets have been doing relatively well, but the European markets, minus the German DAX, have been laggers. Now some may think European markets will see money flows in as investors expect European markets to “catch up”, but the truth is that Europe is in far worse shape than the US. Most western nations are, but the US is the best of the bunch. I can see European and Asian money managers deciding to purchase and increase their exposure in US stocks once the breakout starts gaining more steam.
On the fundamental side, my thesis on a bearish case remains the same: only a black swan event can bring these markets down. I have been saying that this black swan is most likely to come from the US-China trade deal. Well today news came out that President Trump is postponing phase 1 trade talks with China this Saturday. Just my suspicion, but I bet it was really the Chinese who postponed the talks, and President Trump wants the headlines to say it was him in order to prevent a larger market sell off. I say this because just two days ago, President Trump said he was happy with China increasing their purchases of US corn and soybeans and meeting their part of the deal.
Now I want to highlight my Market Moment post regarding a possible market crash. There were 4 charts that I discussed for tracking money flows and indicating on where markets want to go. You can read the post here. Let’s look at the charts one by one, and discuss how they told us markets were moving higher…and will continue to do so.
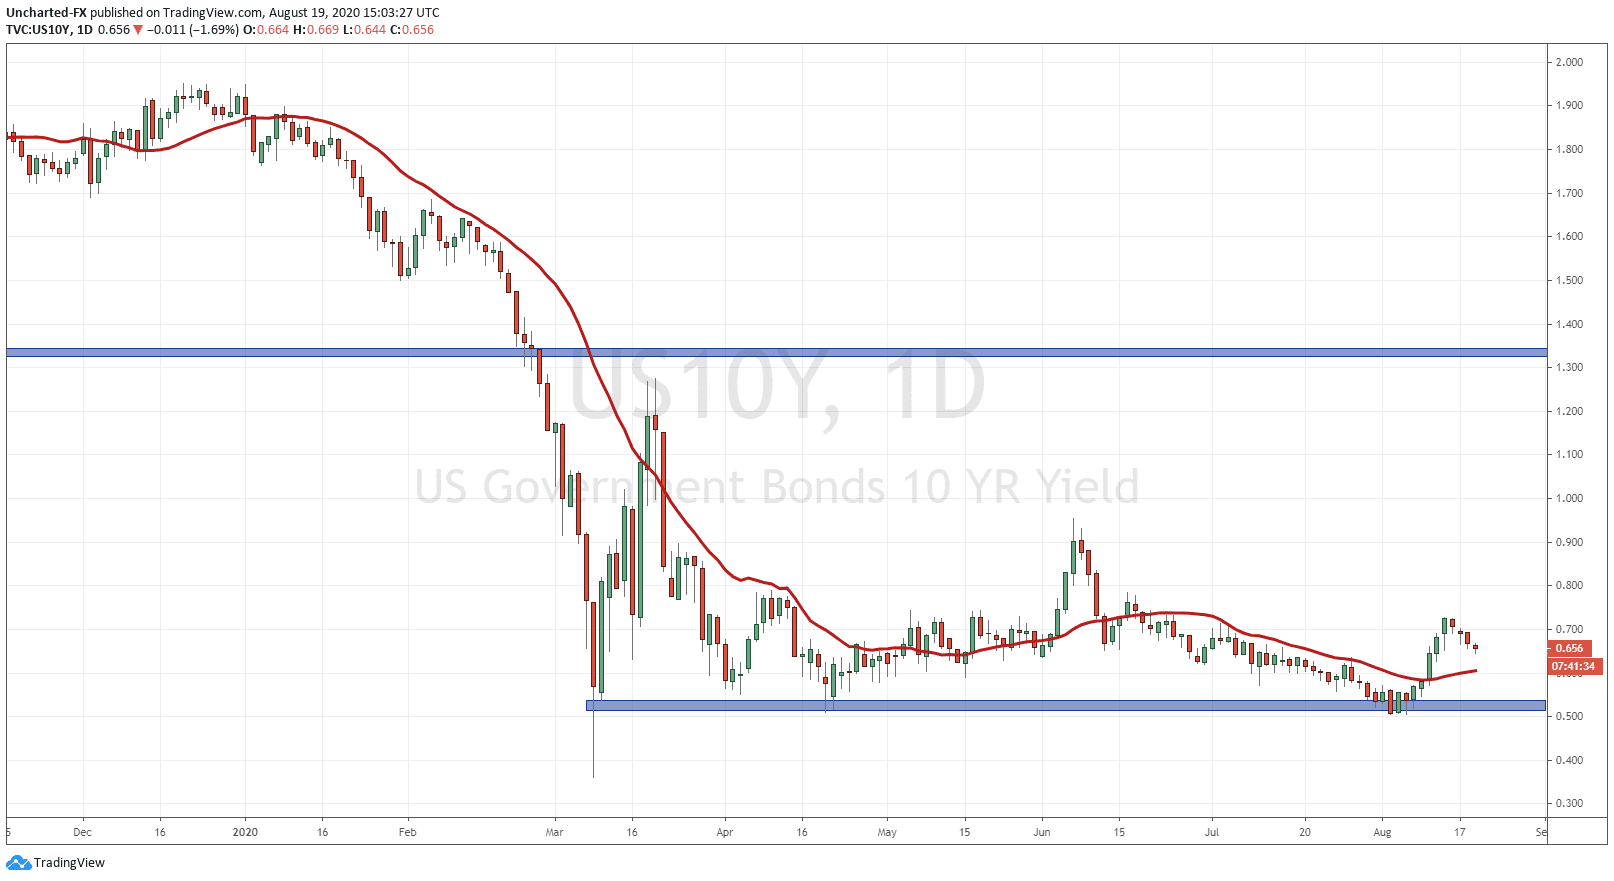
The 10 year yield is our preferred chart to tracing money flows. When this is moving up, it means that money is leaving bonds. Our worry was that we were at a major support zone at 0.50…meaning a drop would signify money entering bonds. This is seen when there is risk and uncertainty. But as you can see, we had a spectacular move in yields shooting from 0.50 to over 0.70 at one point. This is telling us that a large amount of money has left bonds…and following the asset allocation model used by money managers, this money is ready to be deployed into stocks.
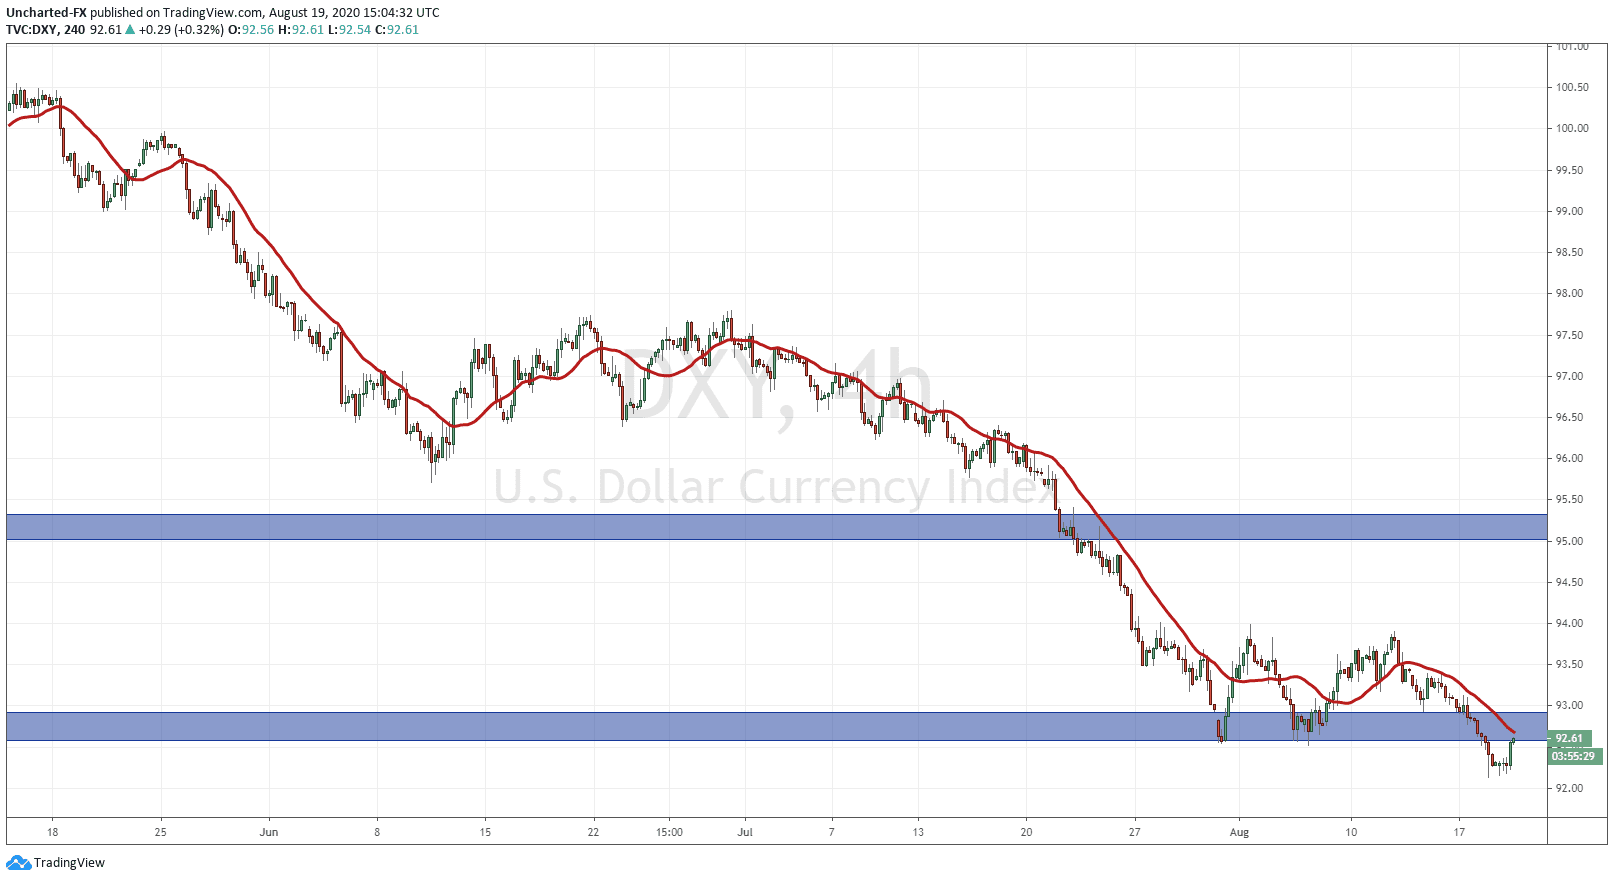
The US Dollar chart was basing for so long, and I was worried we might see a jump up on a double bottom pattern. The trigger would have been the break higher. It never happened. We instead broke lower below support. This is stock market positive, as a weaker US Dollar means it takes more weaker dollars to buy a stock. Inflation. So another factor in rising stock markets going forward.
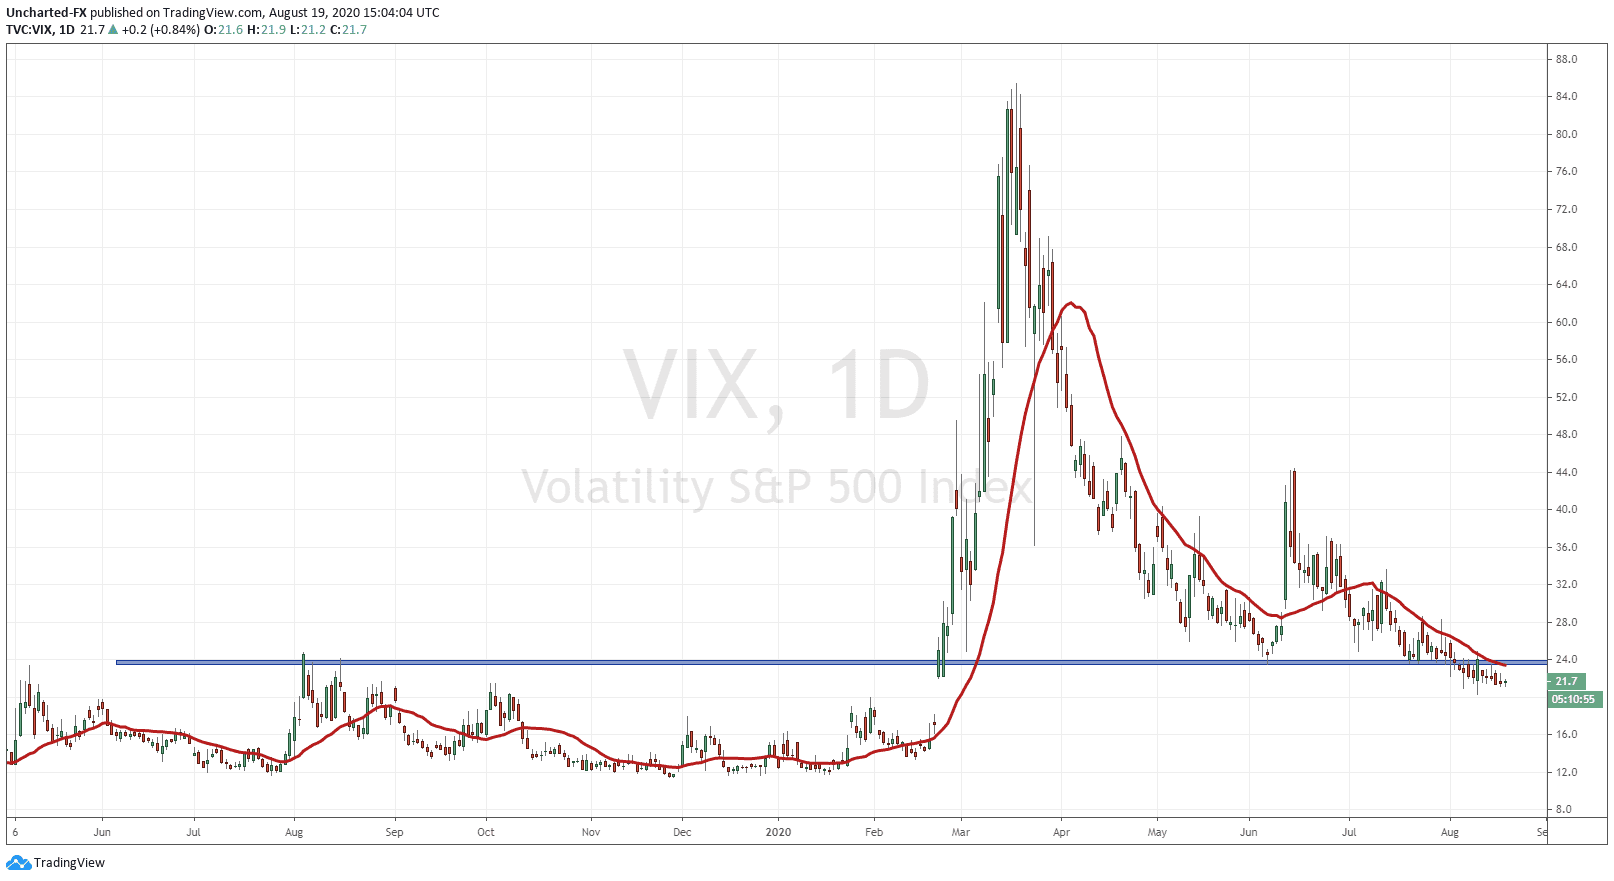
VIX is the volatility index measuring fear. I saw VIX basing at major support at 24, and there was a potential to see a spike from this support. This would mean fear is entering the markets again and markets would drop. What happened instead was a break lower…indicating fear is dissipating. Another positive stock market sign.
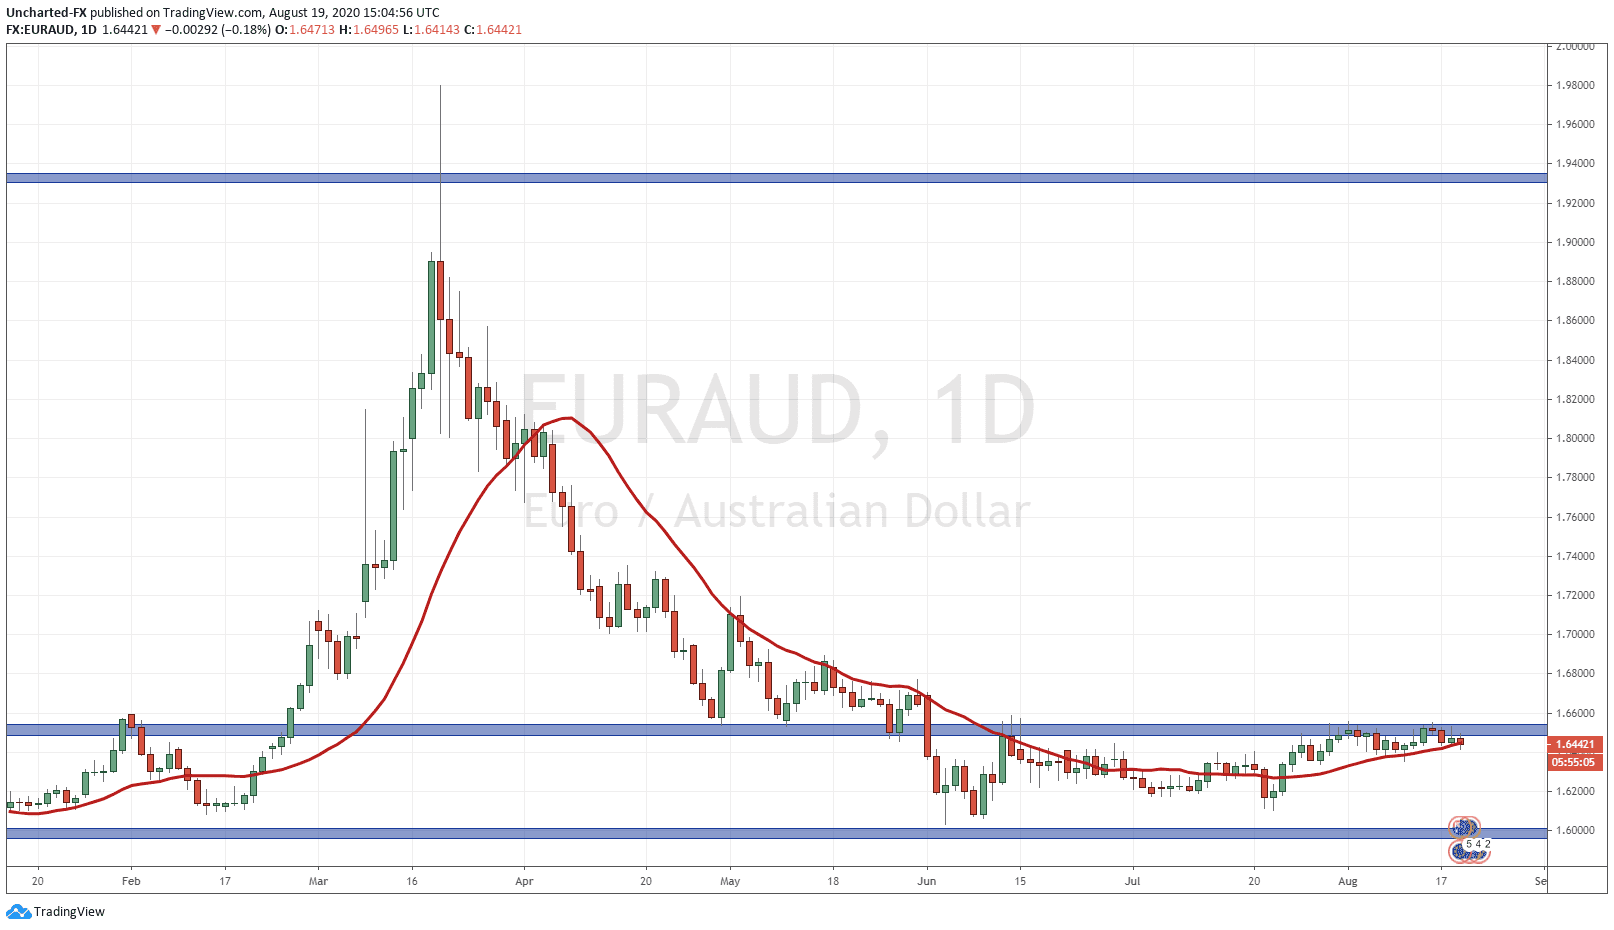
Finally, the currency pair EURAUD. For some reason, this pair has the highest negative correlation with stocks. When EURAUD moves up, stocks move down and vice versa. We were worried about a breakout above 1.6550. But this has not happened. We remain below this major resistance zone, which is stock market positive due to the negative correlation.
As you can see, all the charts I discussed for a potential market sell off all reversed from their danger zones and instead indicated markets moving higher. We will continue to use these charts to follow money flows going forward. Putting more attention on the ten year yield. As mentioned, there is money leaving bonds and has been for a few weeks. This money is ready to be deployed into equities.
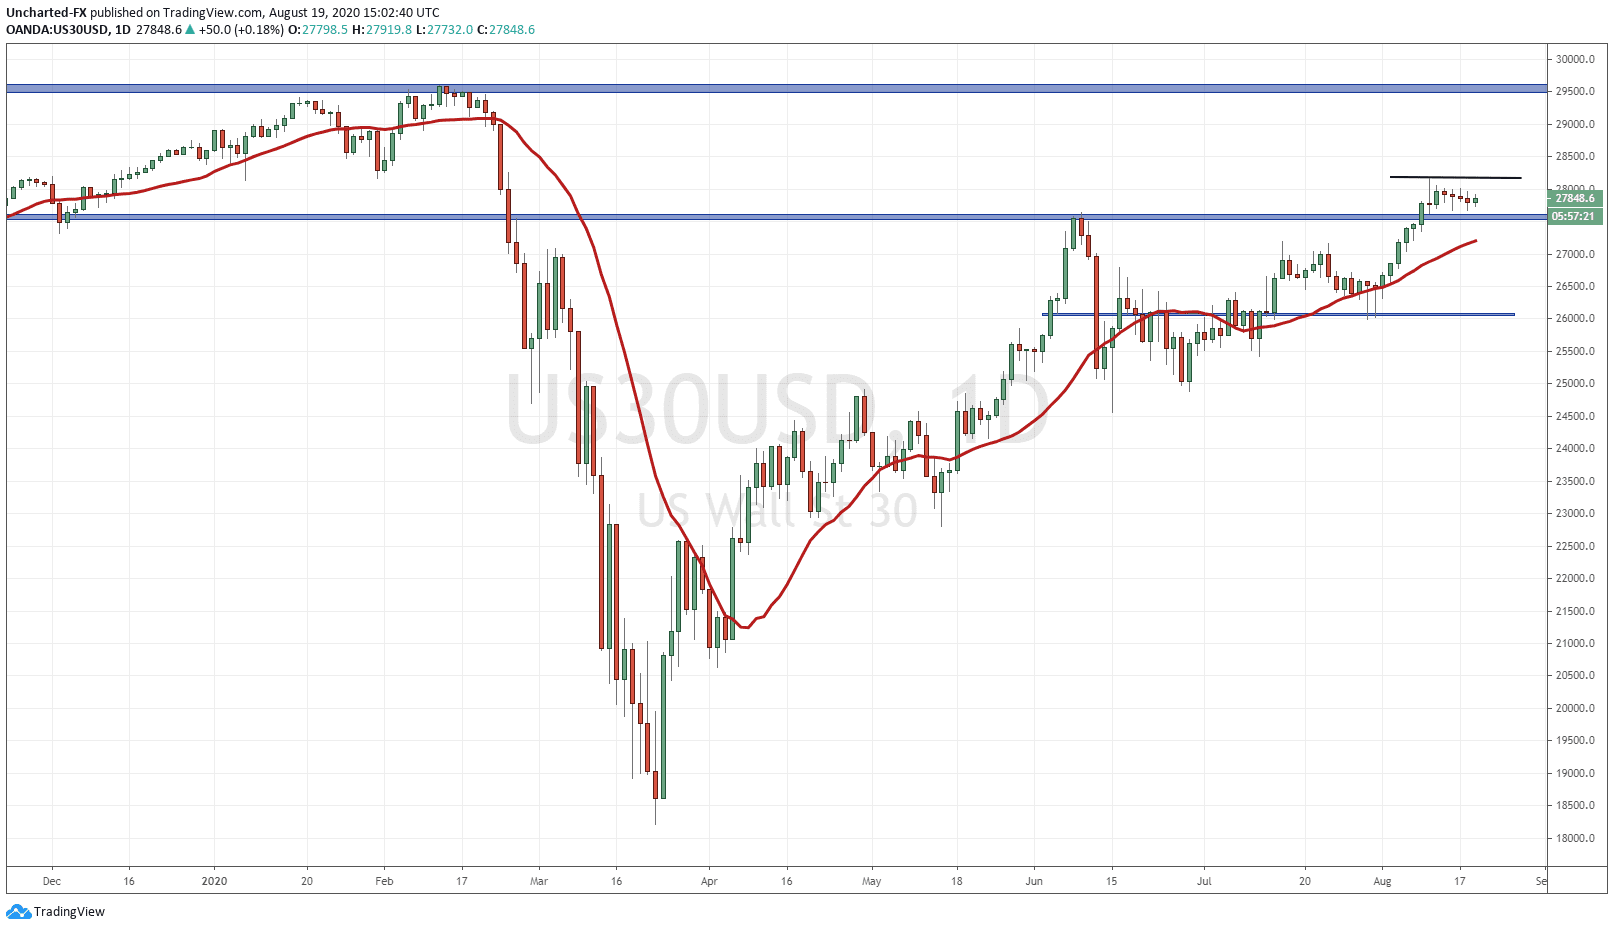
I want to end off with my thesis on money flows to the Dow Jones and the Russell 2000. Both are at major support levels on the daily charts and are bullish as long as they remain above this. My thesis was that once the S&P 500 gives us a sense of direction, the Dow and the Russell will begin to move higher from these levels. So far so good, as the daily charts are showing a green candle, but it is still early in the trading day and anything can happen with FOMC minutes around the corner.
With the S&P and the Nasdaq in record territory, the Dow is the only major US index left to join the party. If you are not in the Dow, one can enter now with a good risk to reward ratio and a stop loss below major support. However, the proper trigger would be to await the breakout, meaning to await for a daily candle close above 28160.