
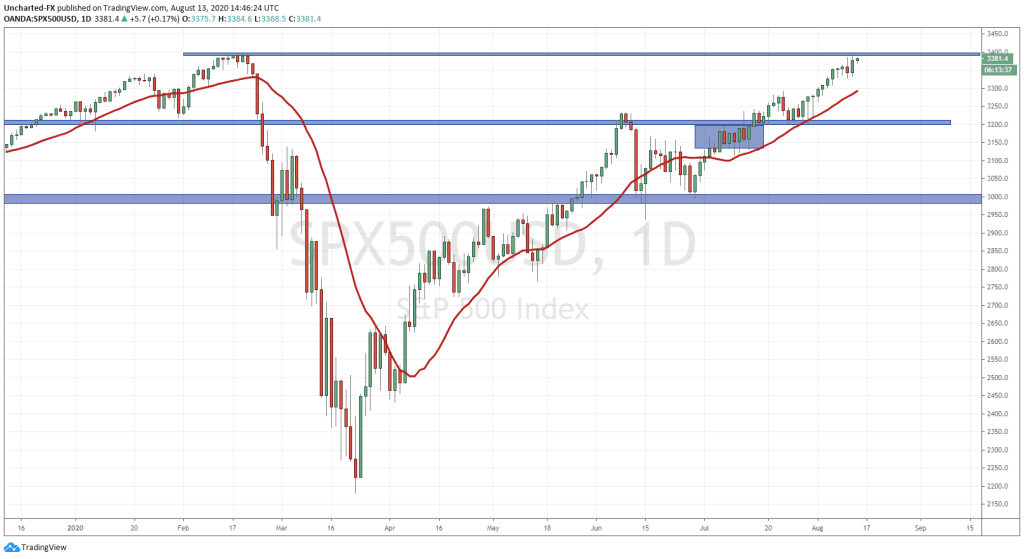
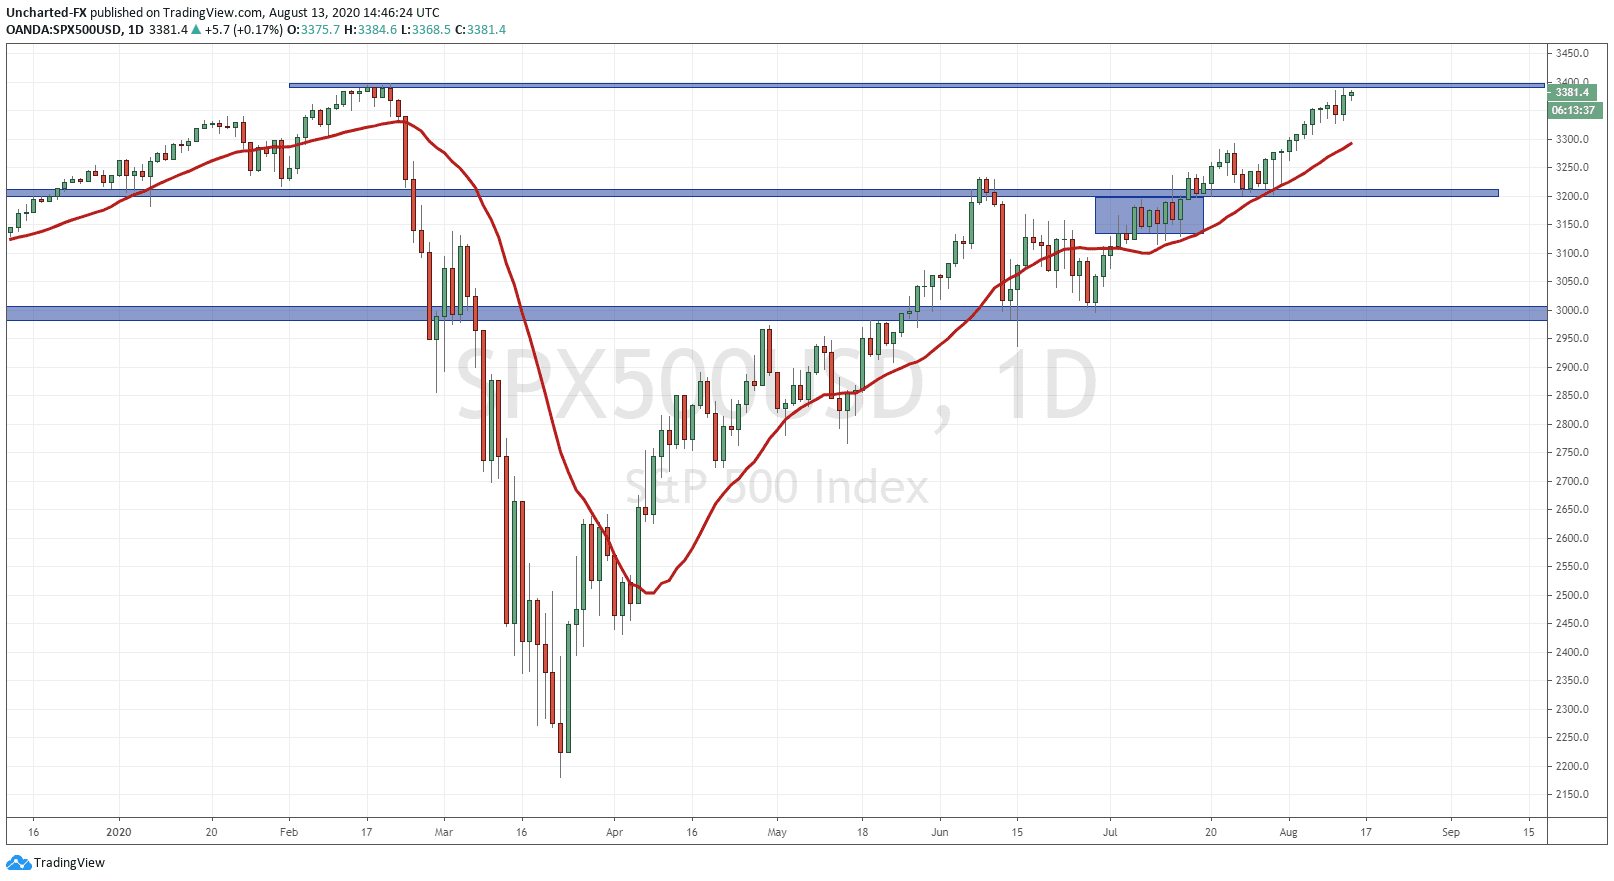
The S&P 500 is knocking on the resistance’s door. Not any resistance though, but previous all time highs. A break above would take us to record all time new highs, joining the Nasdaq. What are the fundamentals which could cause this? Well, today we got new Jobless Claims beating expectations. Jobless Claims come in UNDER 1 Million (at 936,000) for the first time during the pandemic. This is seen as a signal of that economic v-shaped recovery that we are all waiting for. But we know that there is a disconnect between the real economy and the stock market. Stock markets have been moving higher, and have been propped due to monetary and fiscal policy. More specifically, the promise of more cheap money. The major catalyst the markets are looking for is another US stimulus package. We have been told we would get one two weeks ago, last week, and now this week. Nothing has happened. The headline on a stimulus package will move markets in either direction. If it comes out that no stimulus is coming… the markets will react.
If you are still not convinced that markets are moving due to a promise of cheap money, take a look at the British data which came out yesterday. The UK is officially in a recession, with a second quarter GDP drop of 20.4%. The second-quarter plunge is the worst on record and follows a 2.2% contraction in the first quarter. Britain’s quarterly contraction is by far the deepest among comparable advanced economies. French GDP contracted by 13.8%, Italy 12.4%, Germany 10.1%, Canada 12%, the U.S. 9.5% and Japan 7.6%.
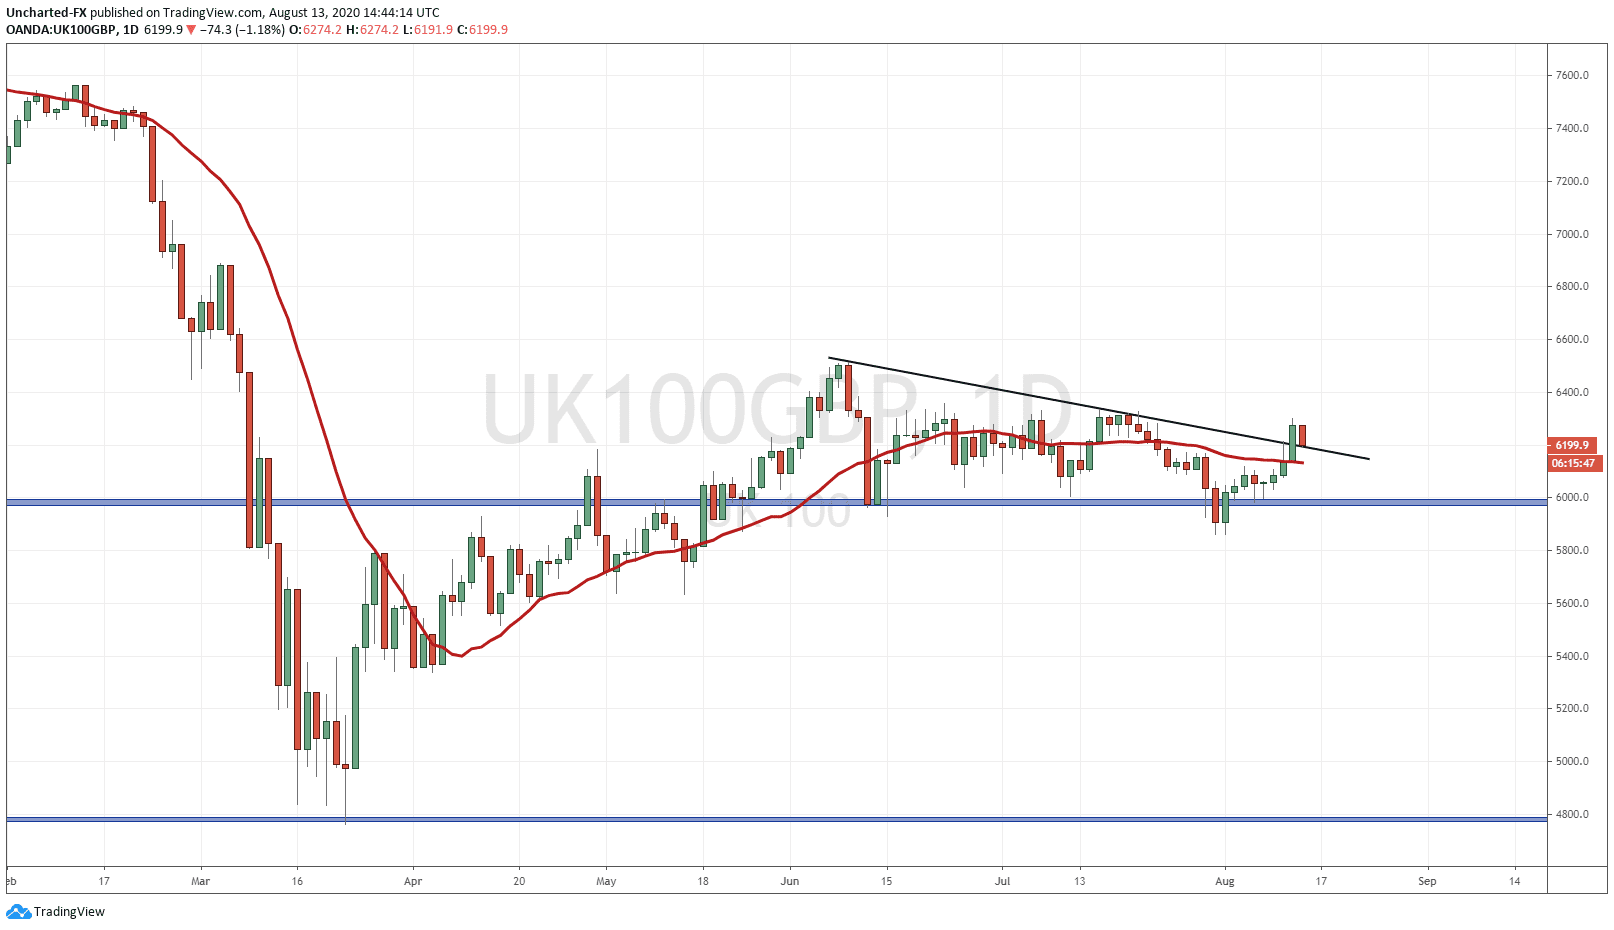
How did the markets react? Well the British Pound did drop only slightly initially, and the UK Stock Market (FTSE) was the best performing index out of all that I watched yesterday with a gain of 2.29%. You can see with my chart that the FTSE actually broke out of a triangle pattern and is bullish (currently retesting the breakout pattern). Why?
Well the Bank of England (BoE) is already at 0.10%, their next moves would have to be negative interest rates. After this GDP data, investors know that the BoE will be keeping interest rates down for much longer. Stocks will become the only place to go for yield. You can even make an argument that this money in Europe will actually hunt yield in US stocks. This would mean a flood of oversea money coming into the US, which would mean a bid in the US Dollar before buying US stocks. This is actually another bullish case for the US, as everyone chases yield in an environment of low interest rates, but the US remains the best looking option out of the Western nations.
We remain long the Russell 2000, and it has been a monster trade for us, and we opened a position on the Dow earlier this week. The S&P is the chart to watch for further market gains. Once the S&P makes new highs, it really would only be the Dow which has to join the party.
So there are three cases here, but obviously only two outcomes.
The first case is a topping pattern here, perhaps a double top or a head and shoulders pattern even on the 4 hour chart, which means stocks fall lower. My readers know that the only thing which could bring markets down is some sort of black swan event, likely connected to the US and China. However, the delaying of cheap money can also dampen market spirits. If negative news on the stimulus bill were to come out, this would be bearish for the markets.
It is likely that stimulus news will be presented as it is now: both sides stalled but still working to come up with stimulus. It is just politics playing out, and the Democrats would look bad if the media spins stories saying they are holding main street as hostages to get policies and money that they want. If this occurs, there is a possibility the S&P 500 just ranges here. Do you remember the “Wuhan zone” resistance I spoke about a few weeks back, and how key it was? Well we ranged at that spot for 7 days! The range is highlighted for you on the chart in the blue box. This sort of price action is possible here.
Finally, the last case is we just breakout very quickly, meaning maybe by today or the end of the week. Once again, the breakout is what I expect, but I just think we range for a few days before, with positive stimulus news being the catalyst.
A few days ago, the major banks believed that vaccine news was NOT priced into stock markets. So when a successful and safe vaccine is developed and used, markets would rocket higher. We had the Russian vaccine announced this week, but was met with skepticism and politics quite frankly. This is another catalyst to watch for if a US company develops one.
What this means is that stock markets can be setting up for a hyperbolic move. Even though we have seen markets recover all their losses, it won’t compare to the move in stocks that is coming. All driven by a hunt for yield in an environment for cheap money, and foreign money chasing US stocks as mentioned prior. We have not seen anything yet.
Finally, I want to remind you of my post regarding the 4 charts you should be watching to predict market action. We have the US Dollar and the VIX moving lower which is stock market positive. But the one chart that is pointing to more market gains is the bond market. The 10 year yield.
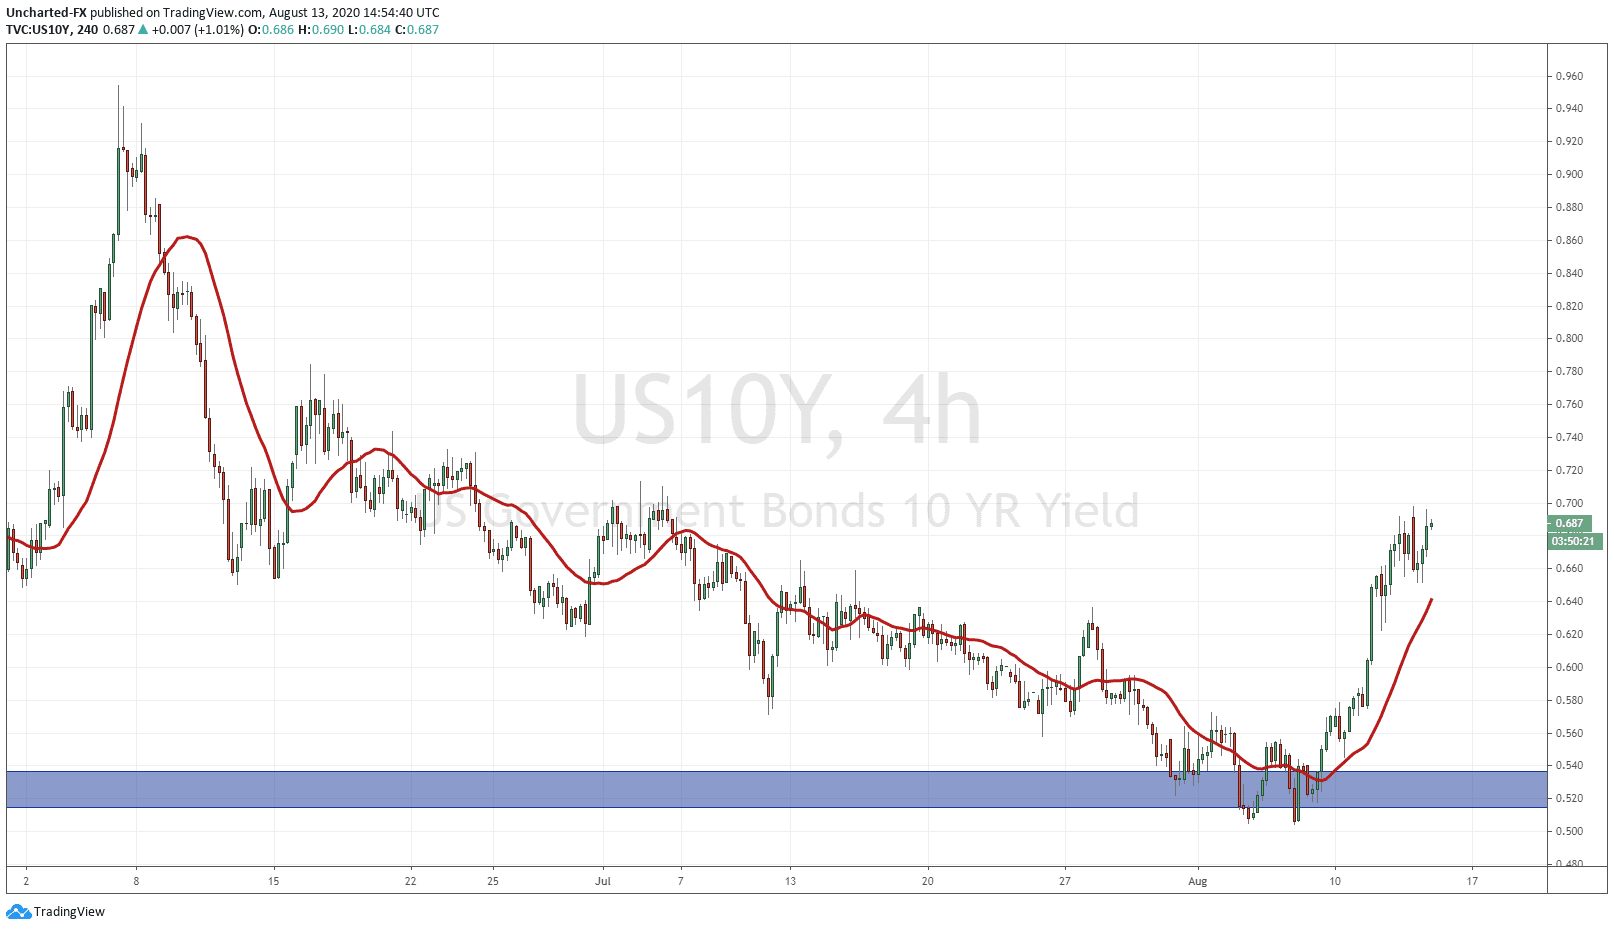
What a move this week on the 10 year yield. You can even see a nice reversal pattern (double bottom/ inverse head and shoulders) at major support. What this move in yield indicates is that money is leaving bonds. Using that asset allocation model, fund managers generally allocate and re-balance their portfolios in stocks and bonds. Money leaving the bond market indicates that money is likely to be entering stocks. Perhaps this money is being kept in cash as ammunition to enter the markets once that breakout or market catalyst news occurs.