

Volatility returned to the stock markets near the end of last week, seeing declines that we have not seen since March of this year. There were signs of this beginning with the topping patterns on the stock market charts on the 4 hour ( mainly the Russell 2000 which tends to lead the large US indices), this dramatically led to a major sell off on Thursday. We saw a roller coaster of a ride in markets on Friday, and this should have been expected given price action on Thursday. It was definitely one for the day traders and short sellers to pile in thinking this was the bear market most believe it should be.
My readers know that the bear market on all the US market indices were nullified with the rejection of the 61.8 fibonacci on the weekly chart, a zone of much importance as I highlighted in the past, and it did take us a few weeks to break through this on the S&P and the Dow. Just simple market structure. For a bear market, we needed a lower high to be confirmed and this did not happen. As previously mentioned, all time record highs were expected by me. This seems more like a pullback.
Now that is not to say this will be smooth sailing. There is one thing that can bring this market down: a black swan event. It would have to be so out of left field, that it would overwhelm the Federal Reserve’s trading desk, and those of the large banks. The media is saying that markets are moving down due to riots and protests, to the Fed’s dovish outlook, and also to the fact that a second wave of covid cases may hamper US economic recovery on the re-openings that are occurring.
I want to remind my readers that the real economy and the stock markets are entirely two different entities. This market has shrugged off a pandemic, great recession like unemployment, millions of layoffs and record breaking economic data. It seems like the buy the dip and stonks days are back. Rationality is out the window: Tesla breaching $1000 per share, Chesapeake Energy going from $15 to $70 then back to $16 dollars, and Hertz getting a bid are all signs of this. Markets are the only pace to go for yield. For real yield.
Let us look at the Fed’s words. Was anyone expecting Fed chair Powell to say the economy is recovering after that unexpected jobs data? Many know that the Fed cannot normalize given all this new debt that has been issued. Do not forget the fiscal side too. Governments want low interest rates to service all this new debt especially when tax revenues will be low or non-existent. Low interest rates are here to stay for a long time. Powell is telling us at least through to 2022. In my opinion negative rates are coming, but as we know, these do not work. The Keynesians argue that negative rates do not work in Europe and Japan not because of the policy, but due to the fact rates were not cut deep into the negative enough, and not enough money was printed. Digital money is seen as the solution as it would force people to keep their money in banks and therefore pay the banks. The Keynesians think this would force people to spend money to create inflation and growth. You must punish the savers.
In fact, Fed chair Jerome Powell will get a second chance in clarifying his words and outlook. He is testifying to congress on Tuesday and Wednesday this week. Expect the politicians to praise him and tell him he is a hero and thanking him for his service. Also, depending on price action, watch Powell to try to butter up the markets and make it clear, if it has not already, that the Fed will keep markets propped and supported.
So once again, I ask you: where do you go for yield? Fund managers need to make money, and they will not make much in fixed income anymore. Stocks are the only place to go, and the Fed has created an environment to force money into stocks. All the programs they have instigated is to keep everything propped. Propping corporations, propping small businesses, propping other countries with their Dollar swap lines, propping banks (maybe even hedge funds as some speculate) with repo. Do not forget the fiscal side. The US government is expected to announce another sort of stimulus program in late July. One of the highlights of Powell’s FOMC rate decision on Wednesday was he implored the government to do more. Hinting that the Fed does not want to go down a path it cannot turn back from. Propping everything and being buyers of last resort. Nonetheless, the Federal Reserve has pledged to keep stock markets propped. Wall street knows this. They know the party is not over. They will continue to ride this to make unbelievable amounts of money, and when it is over, they will blame the central banks.
So I said a lot about the fundamentals, but many of you already know my opinion on that. Let’s look at the technicals.
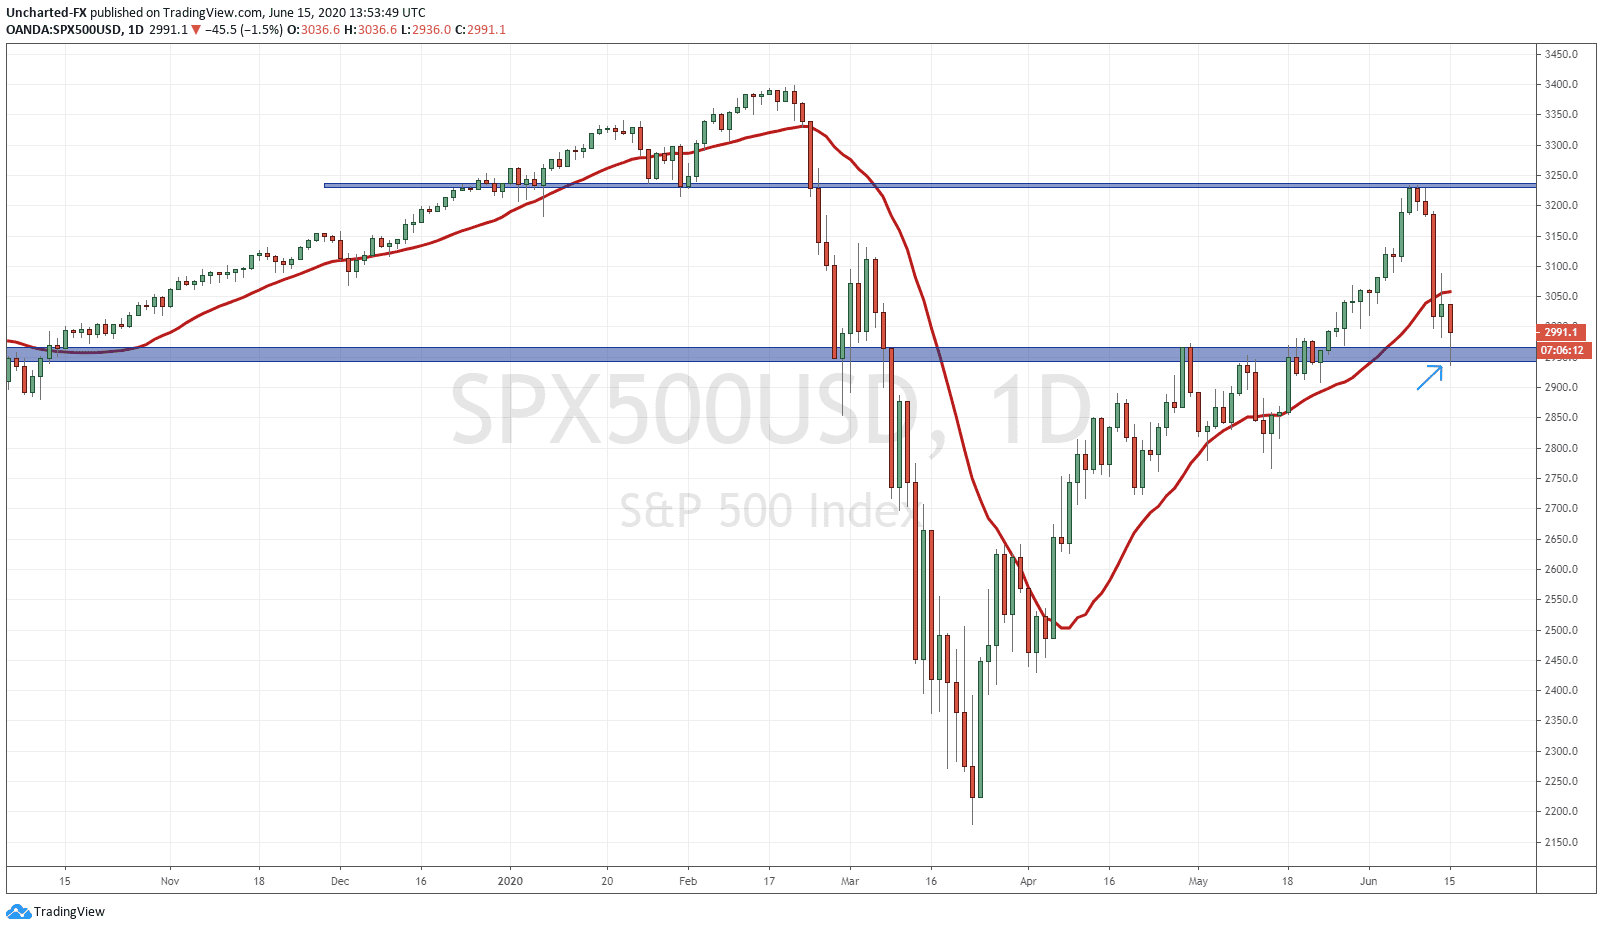
Just a quick lesson on market structure that my readers are already familiar with. Remember, markets are in a trend as long as they hold the current swing. In an uptrend that would be a higher low and in a downtrend that would be a lower high. In the case of the S&P 500 , the higher low is at the 2940 zone. We have not broken that, which means this is just a pullback in the uptrend. We almost touched that support on Friday, but you can see the buyers are beginning to step in. We have formed a doji as well indicating the battle between the bears and the bulls. Closing green too was quite the sign too. For the swing traders, take a look at the 4 hour chart. Look how we are now forming large wicks at major support. This is indicating buyers are stepping in.
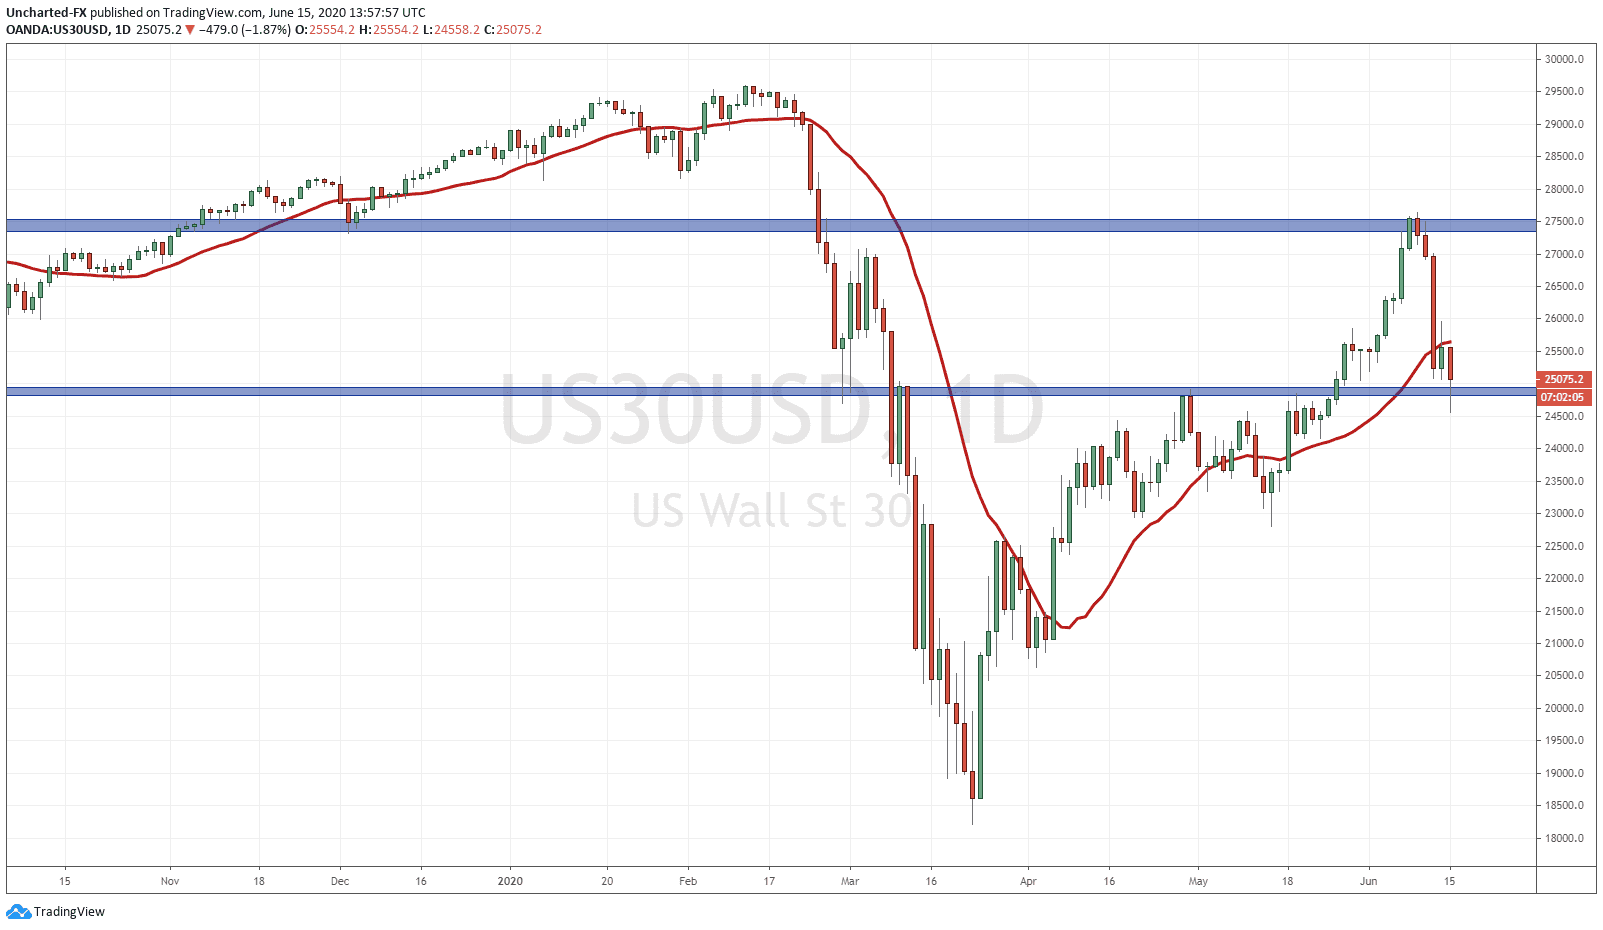
The Dow is also at a very significant level. The big 25000 zone, which also is where the higher low is located. I expect buyers to step in here and we are already seeing signs of this.
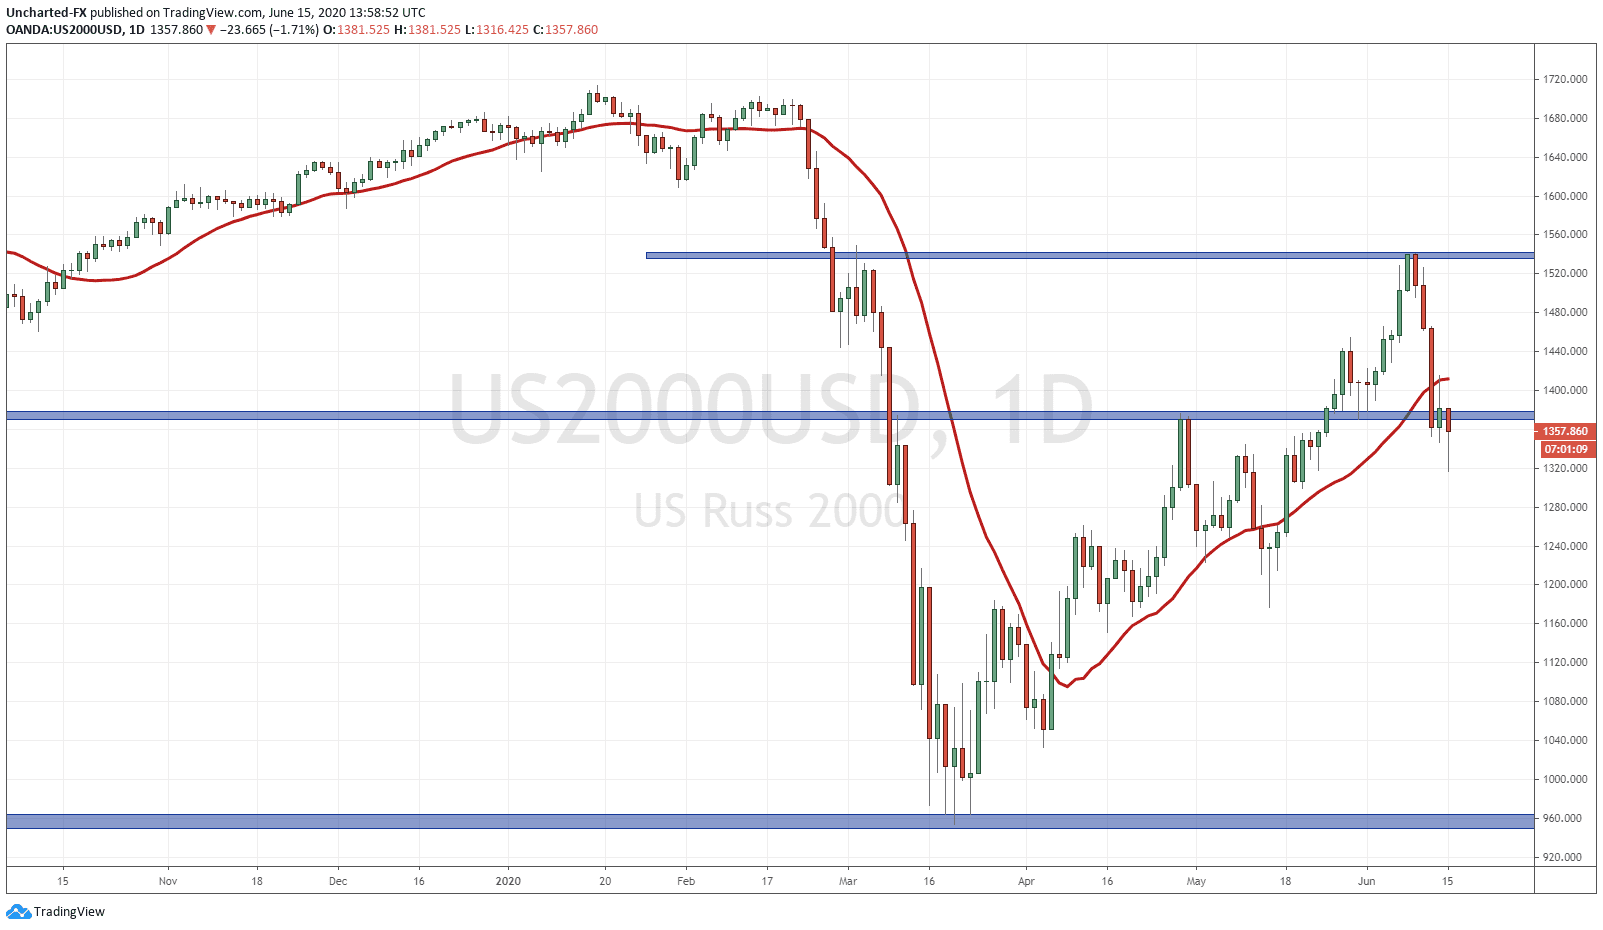
I will watch the Russell for this week and especially for today’s daily candle close. We did in fact close below the higher low on Thursday, but then recovered on Friday and potentially created a false breakout. You can see it is a very key support area as well.
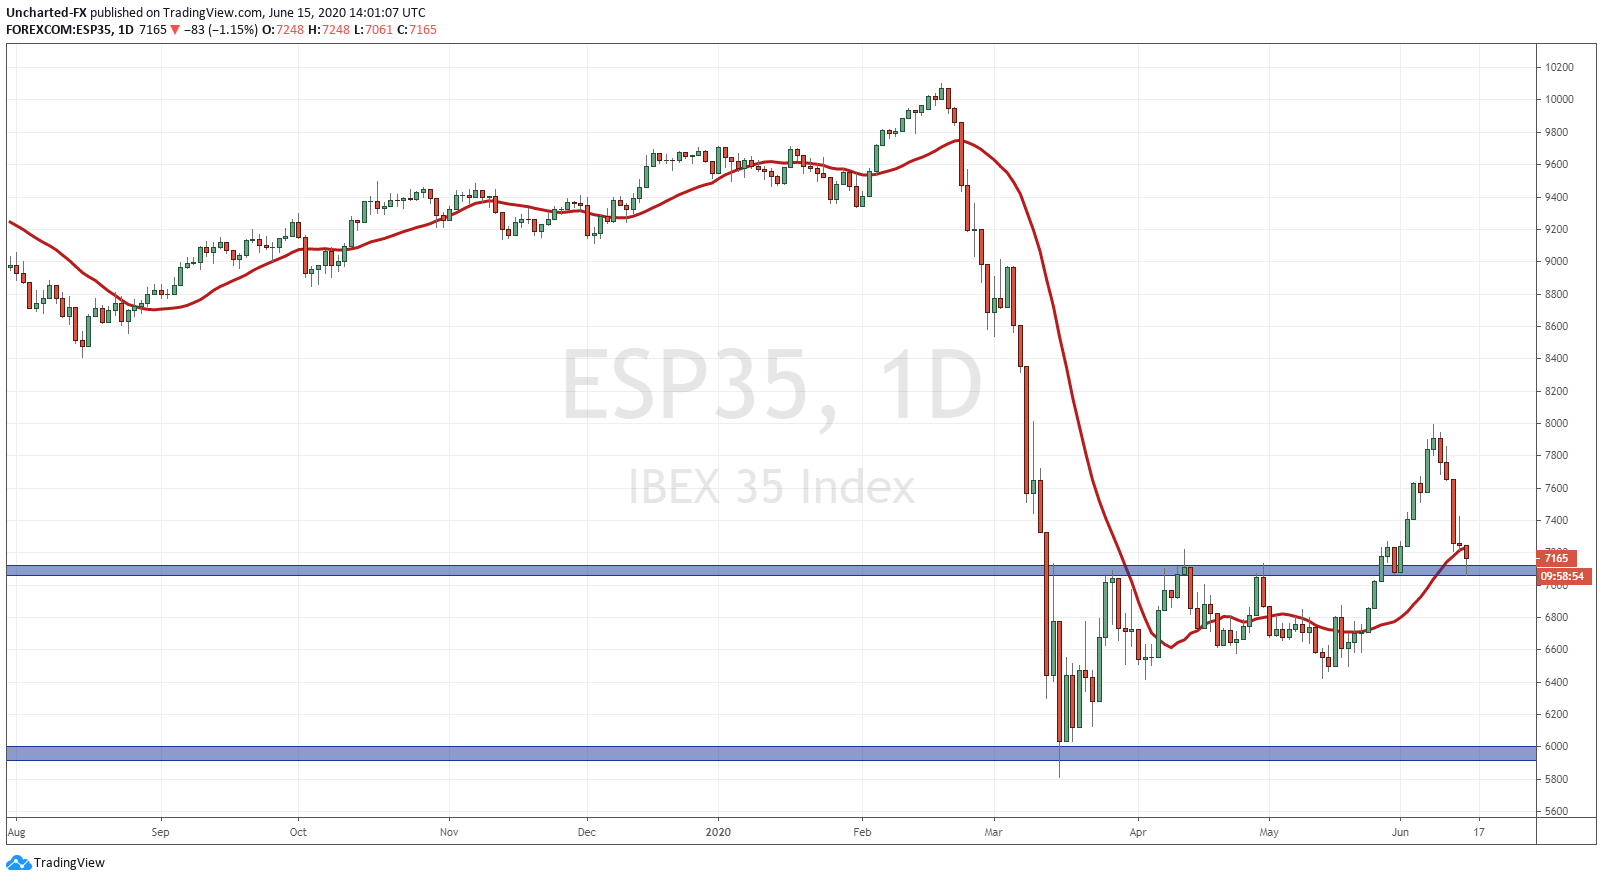
I want to share some other European equity charts which seem to show a pullback to a previous support level.
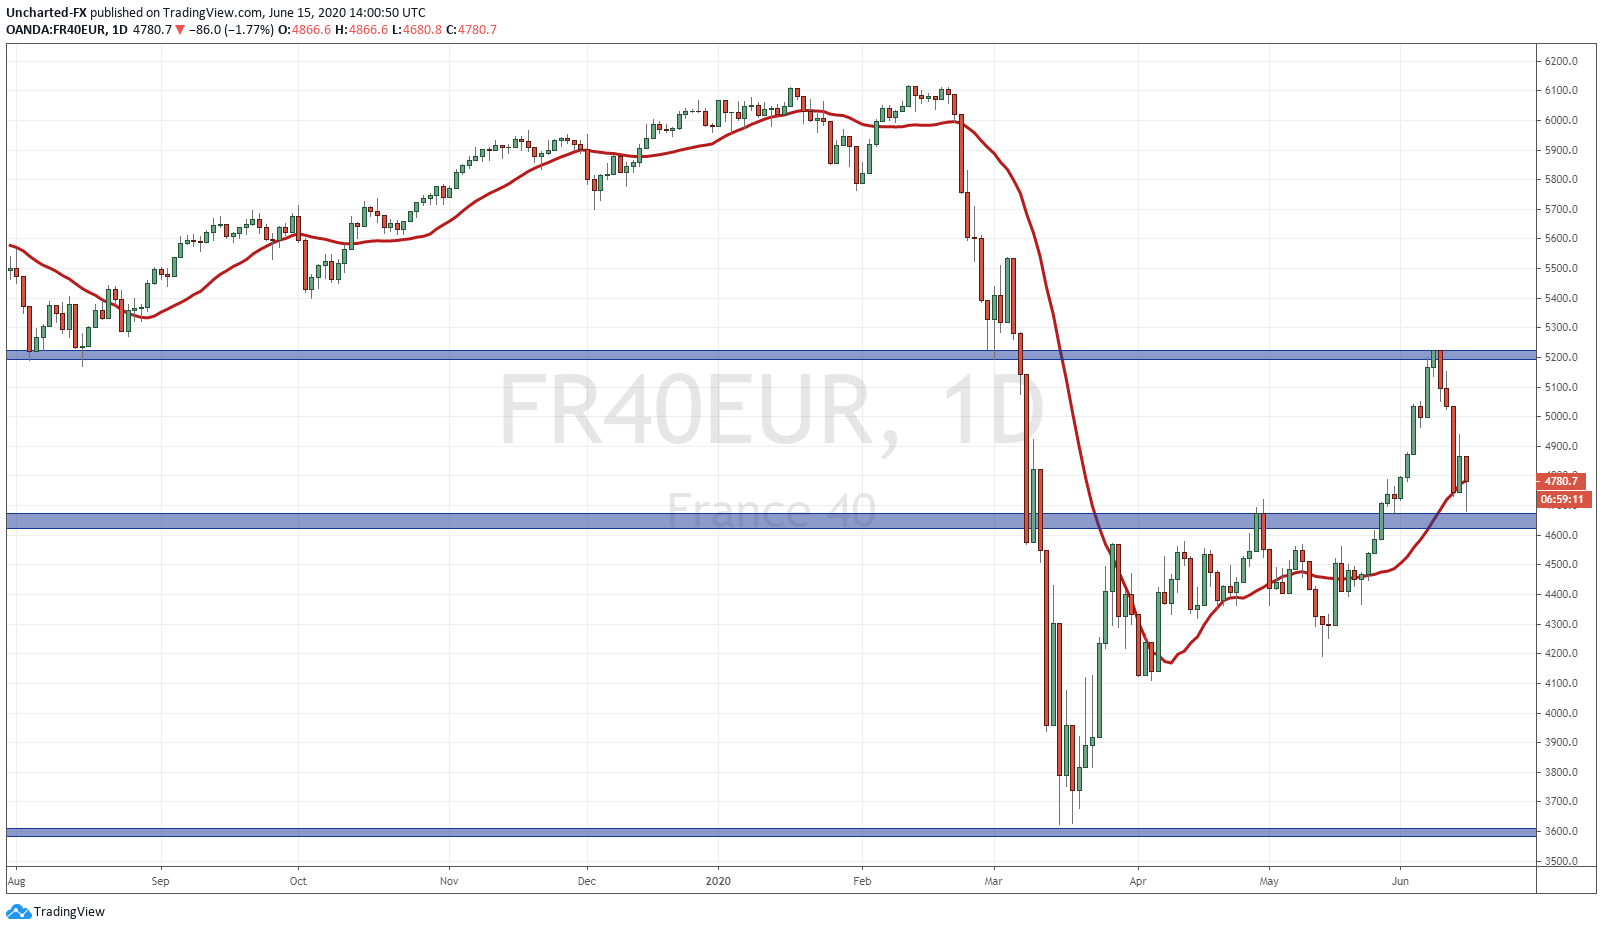
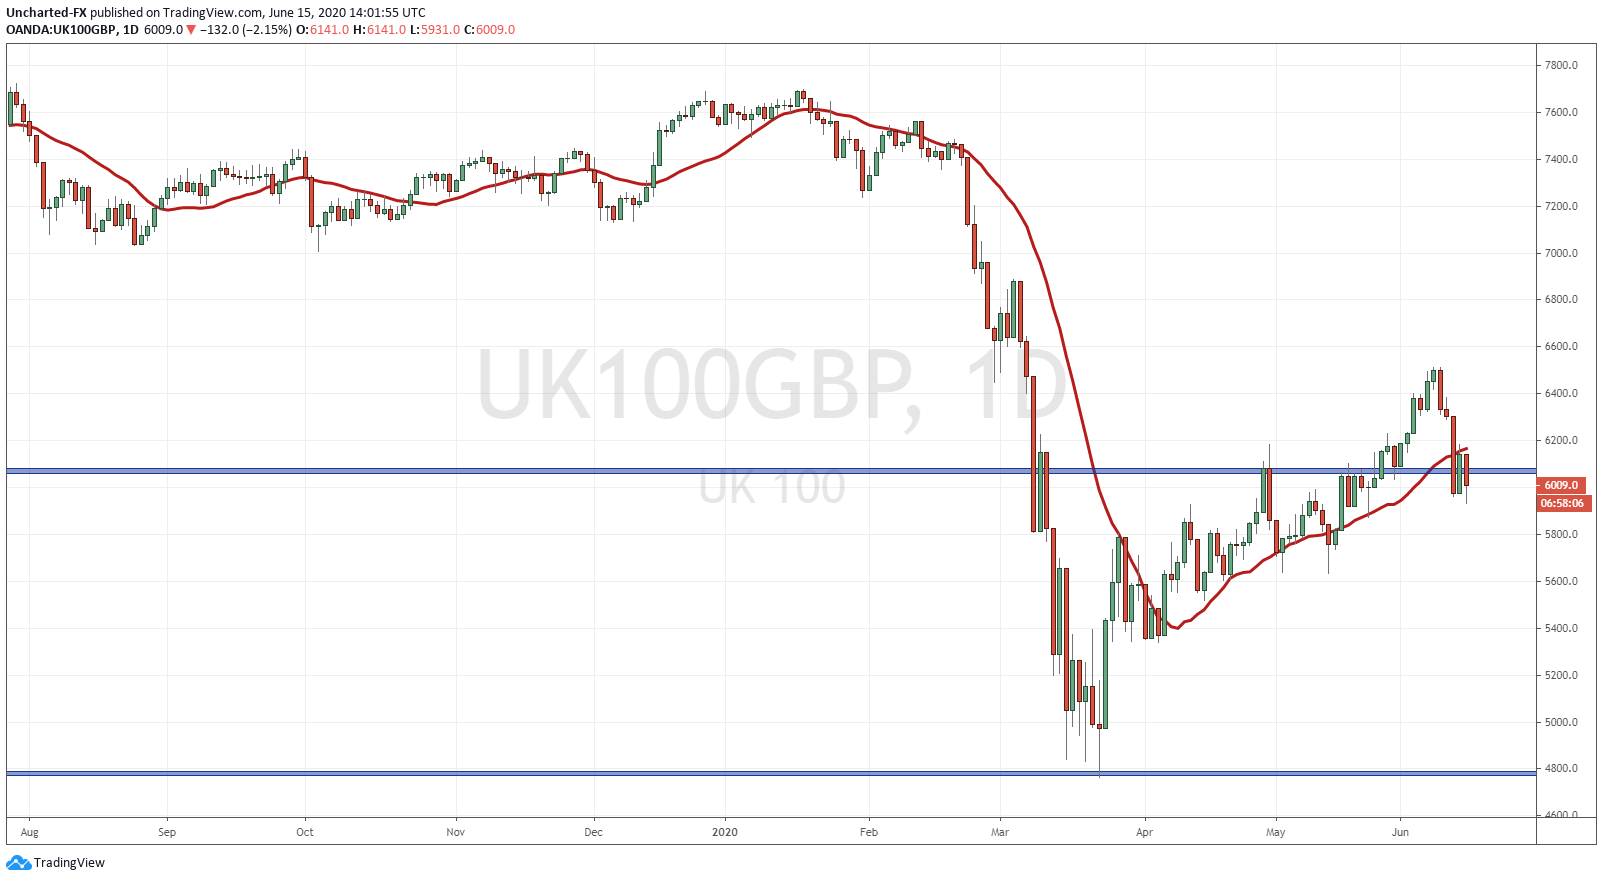
Notice the fake out on the UK FTSE. I will be watching today’s daily candle close just like the Russell 2000.
So how do we play all of this this? Watch price action come Monday. I have said the 4 hour charts are showing the buyers step in, but the daily chart trumps the lower time frames. Especially when we are at KEY DAILY support/flip zone chart levels. Await how price closes on the daily candle on Monday. I expect to see large wicks, or perhaps even indecision doji candles. We will assess the markets once these candles close. My gut feeling is telling me that today could be a red day but then see buyers step in near the end of the day. See a large red candle lower, and then a bid up which creates a daily candle with a large wick which traps the bears. At time of writing, we have seen the 4 hour candle play this out with a drop and large wick which will translate to a large wick on the daily close.
One last thing: watch the 10 year yield. My followers know the importance of this. It is a chart I continuously post over on our Discord channel. It is the one chart to watch. If the 10 year yield remains stable here, or pops higher, expect markets to move higher. If the yield drops, then the market sell off can continue.
Trade ideas and market discussion can be found on our Public Discord Channel: https://discord.gg/akcgCVP
Check out and subscribe to our Youtube channel where charts and market events are discussed on our Morning Market Moment show: https://www.youtube.com/channel/UCG7ZYDUeNANJiDxH88F9aQA