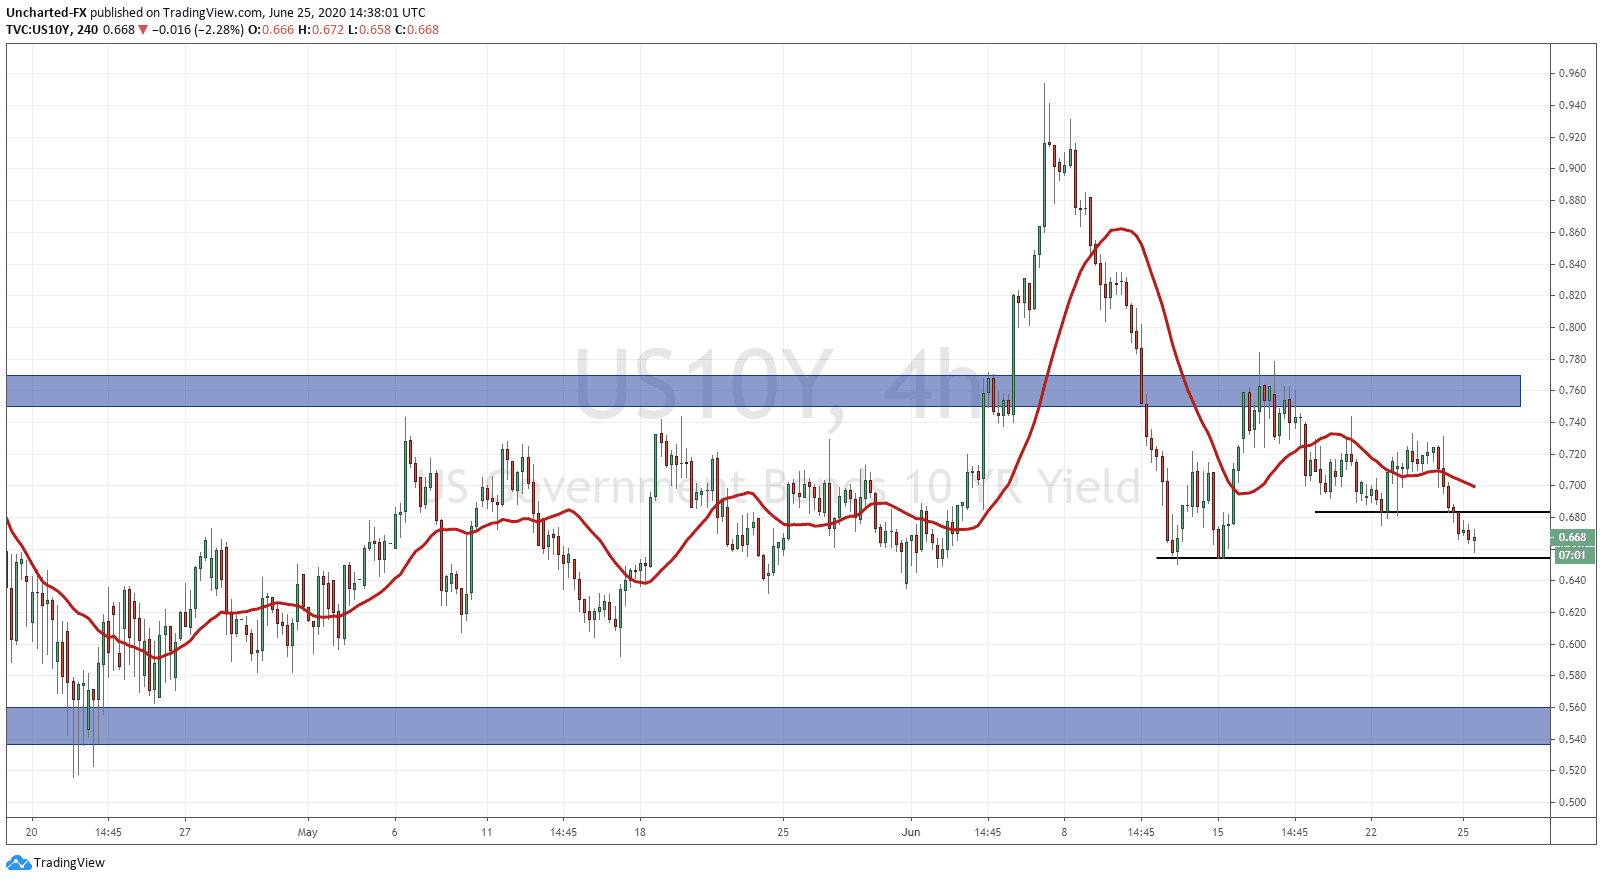
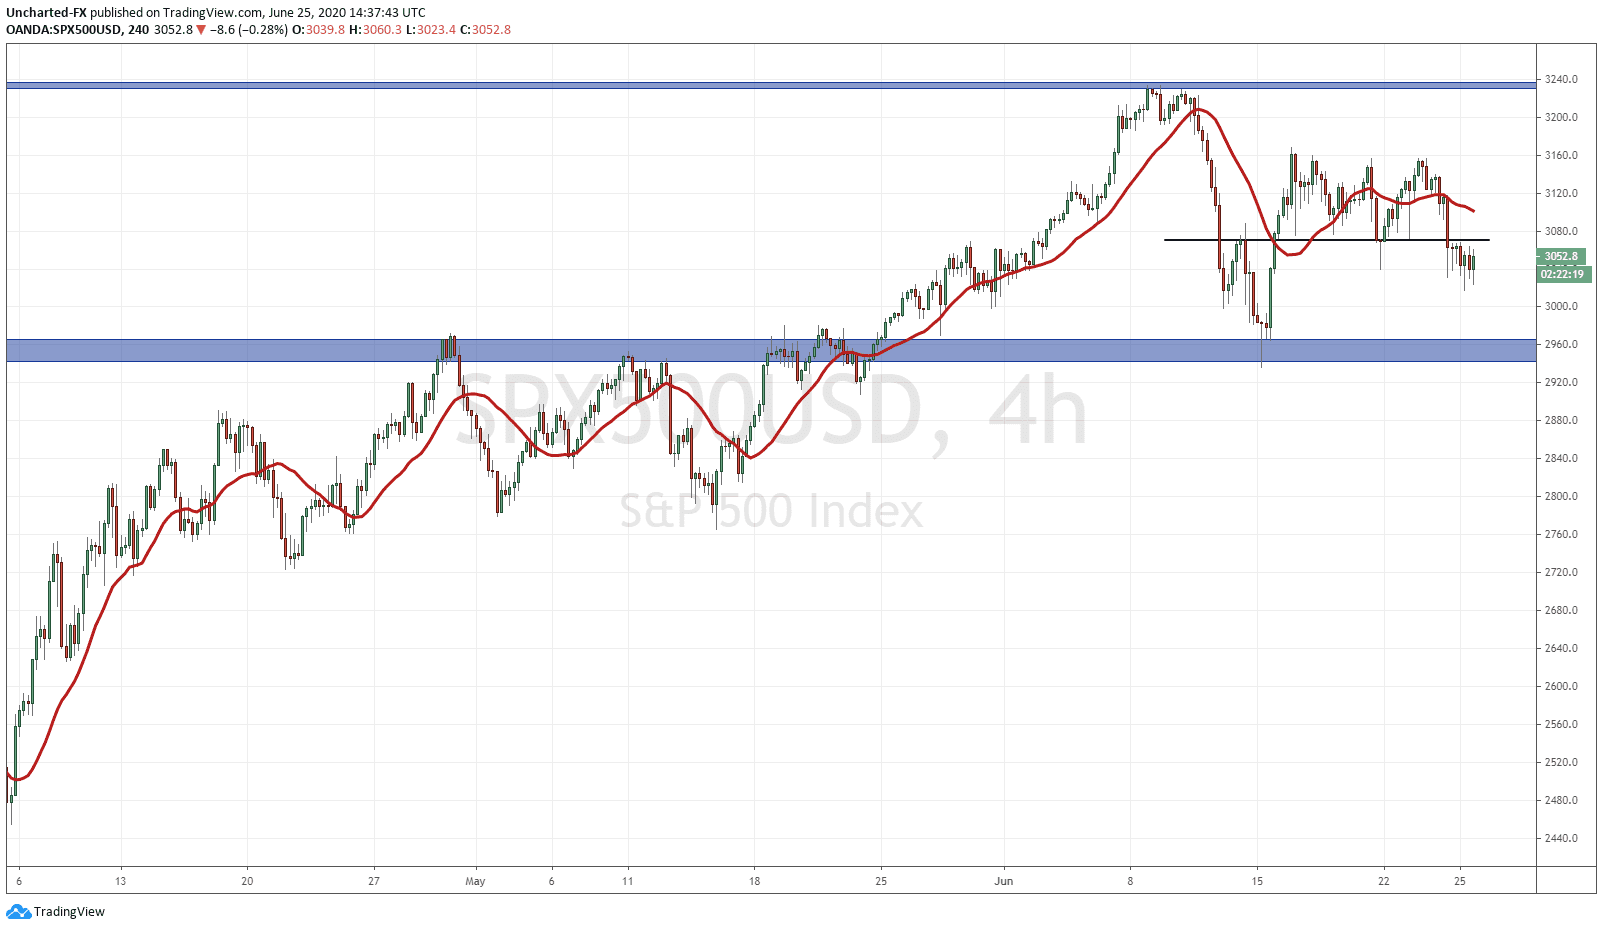
Stock markets continue their slide downwards on the opening. The S&P has broken below support, tested support now turned resistance overnight, and has continued lower. This was all outlined in yesterday’s Market Moment post, and members of our Discord channel knew this was the game plan to trade this range for quite some time. I don’t like trading ranges but prefer trading the breaks of ranges. This requires some patience and most of trading is waiting for the right opportunity and your trade criteria to be met. This week I spoke about the battle between fear and greed in the markets. The greed side being money flowing to stocks because of the Fed’s monetary policy, and how they have created an environment where you will have to be in stocks to make yield going forward. The fear side is obvious but deals with multiple things: covid, US China trade deal, riots/protests are the big three. It seems like the fear side is winning, and as long as the S&P remains below that resistance zone, I expect markets to move lower. By the way, the 10 year yield is moving in a way which indicates that money is heading into the safety of bonds. It is at a big support level it held previously at 0.66. Would want to see a move lower for further equity downside.
Just like every Thursday, the Jobless Claims data takes centre stage. Jobless numbers came out at 1.48 million beating expectations. Continuing claims is still high. The financial mainstream media is saying that this is showing signs of a choppy recovery…many market commentators are saying try no recovery. Last week the narrative on jobless claims was that there might be a second round of layoffs as companies try to work around the debt after being closed for a few months. However, there is another second wave story weighing more on the markets.
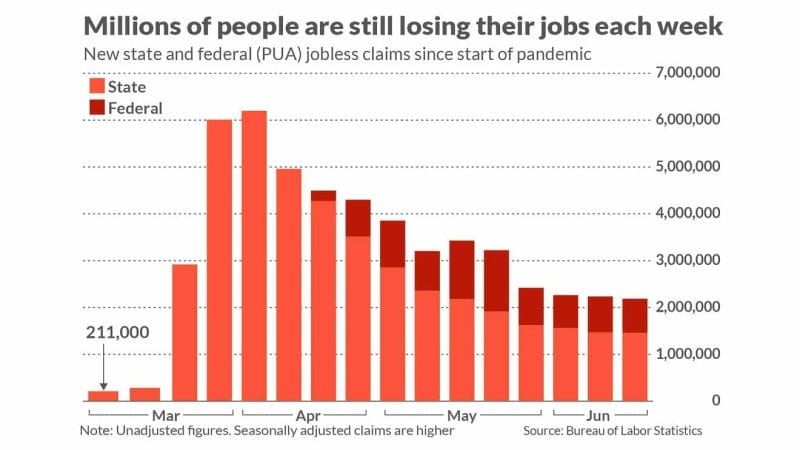
We are seeing Covid cases spike in certain parts of the US. Record spikes and surges in fact. The use of the phrase “second wave” is not correct according to Dr. Fauci who believes this is still the first wave. The fear element is real. Mainstream media are peddling out fear headlines. The term being used for headlines is “we are in deep trouble” on these record surges. This is weighing on the markets.
On the longer time frames I find the charts of some Gold juniors very interesting. Many of you know I am bullish on Gold for the long term. Gold is the confidence crisis asset. People run into it when they lose confidence in governments, the central banks and the fiat money. All of these are either happening or are in the process of happening.
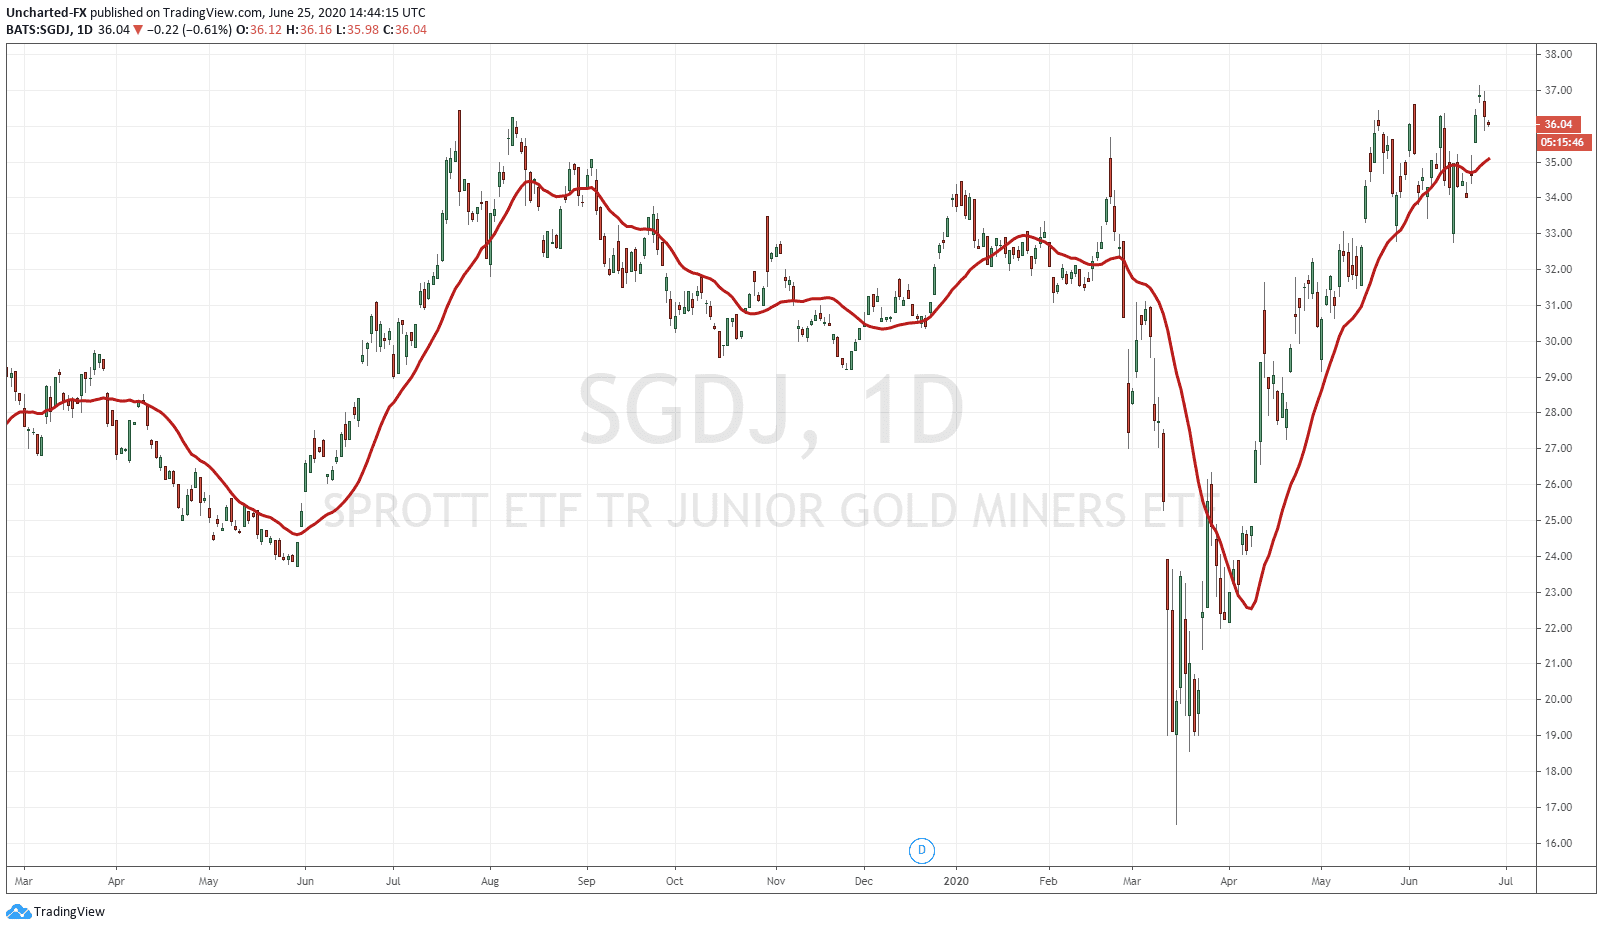
At the Vancouver Resource Investment Conference back in January of this year, I was showing Mining company execs my charts of Gold’s weekly break out at 1406 and how a second higher low above previous highs of 1530 were coming all because of market structure and the macro environment. I still believe Gold will be making all time new highs against the US dollar just as it has with plenty of other fiat currencies around the world. There will be a great opportunity in the Mining space which is already occurring. Readers and Discord members know about the significant break out on the GDX on the weekly chart. As long as we remain above 31.11, the GDX is in a new bull market. On the junior side we did get a break out on Sprott’s Junior ETF the SGDJ, and it is now retesting the breakout zone so I will keep an eye on that going forward.

The charts for Nexus Gold indicate beautiful market structure. The best thing is, which adds to the strength of the technicals, is the pattern is the same on the daily and the weekly charts!
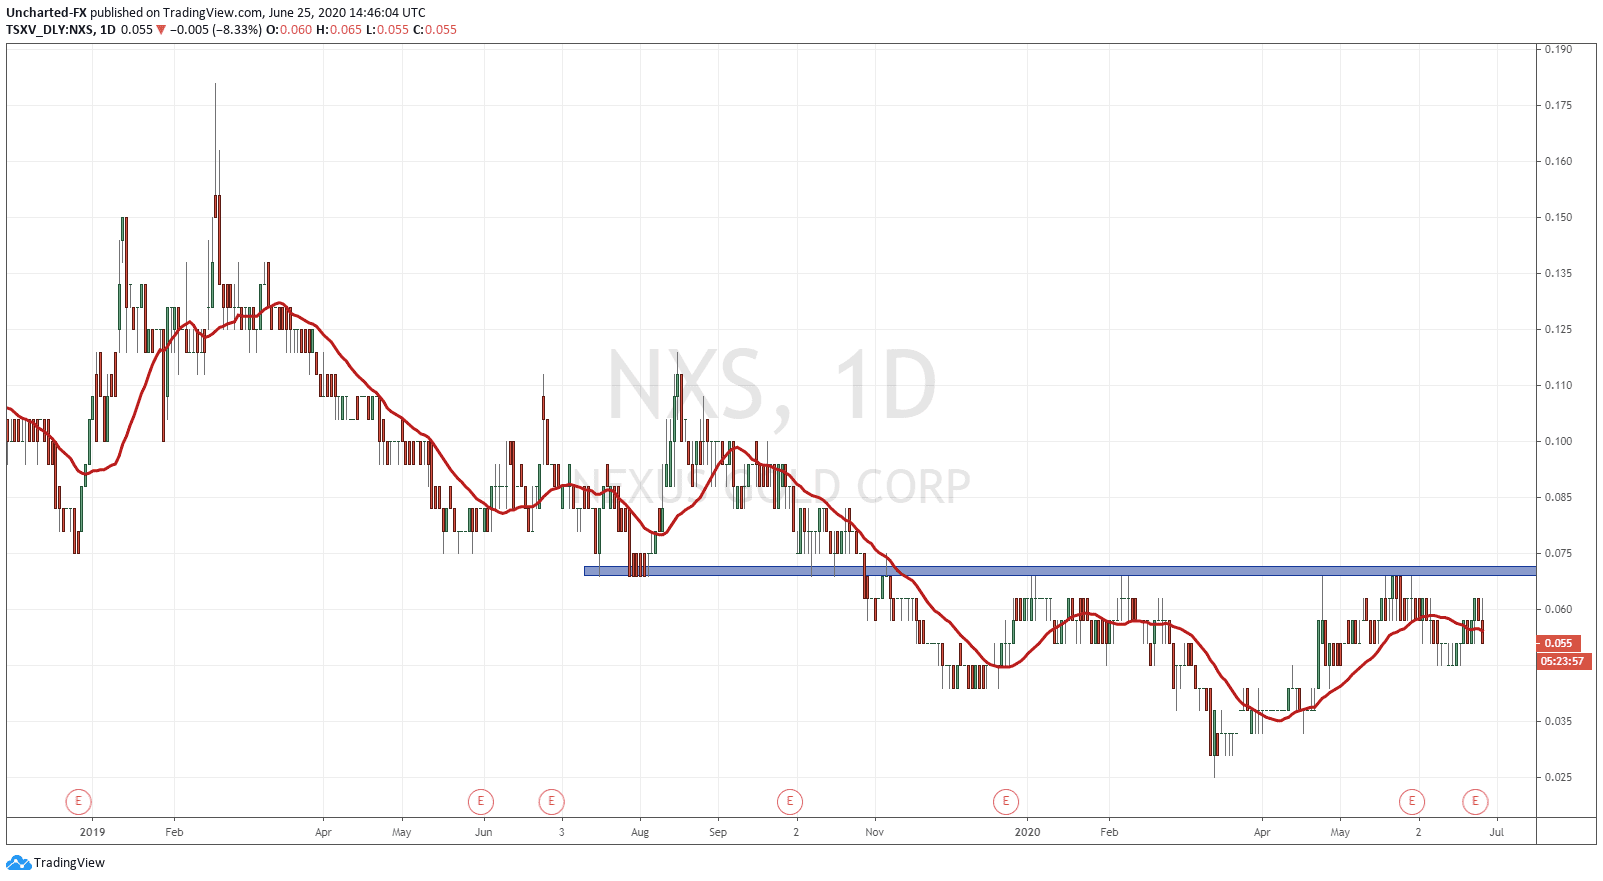
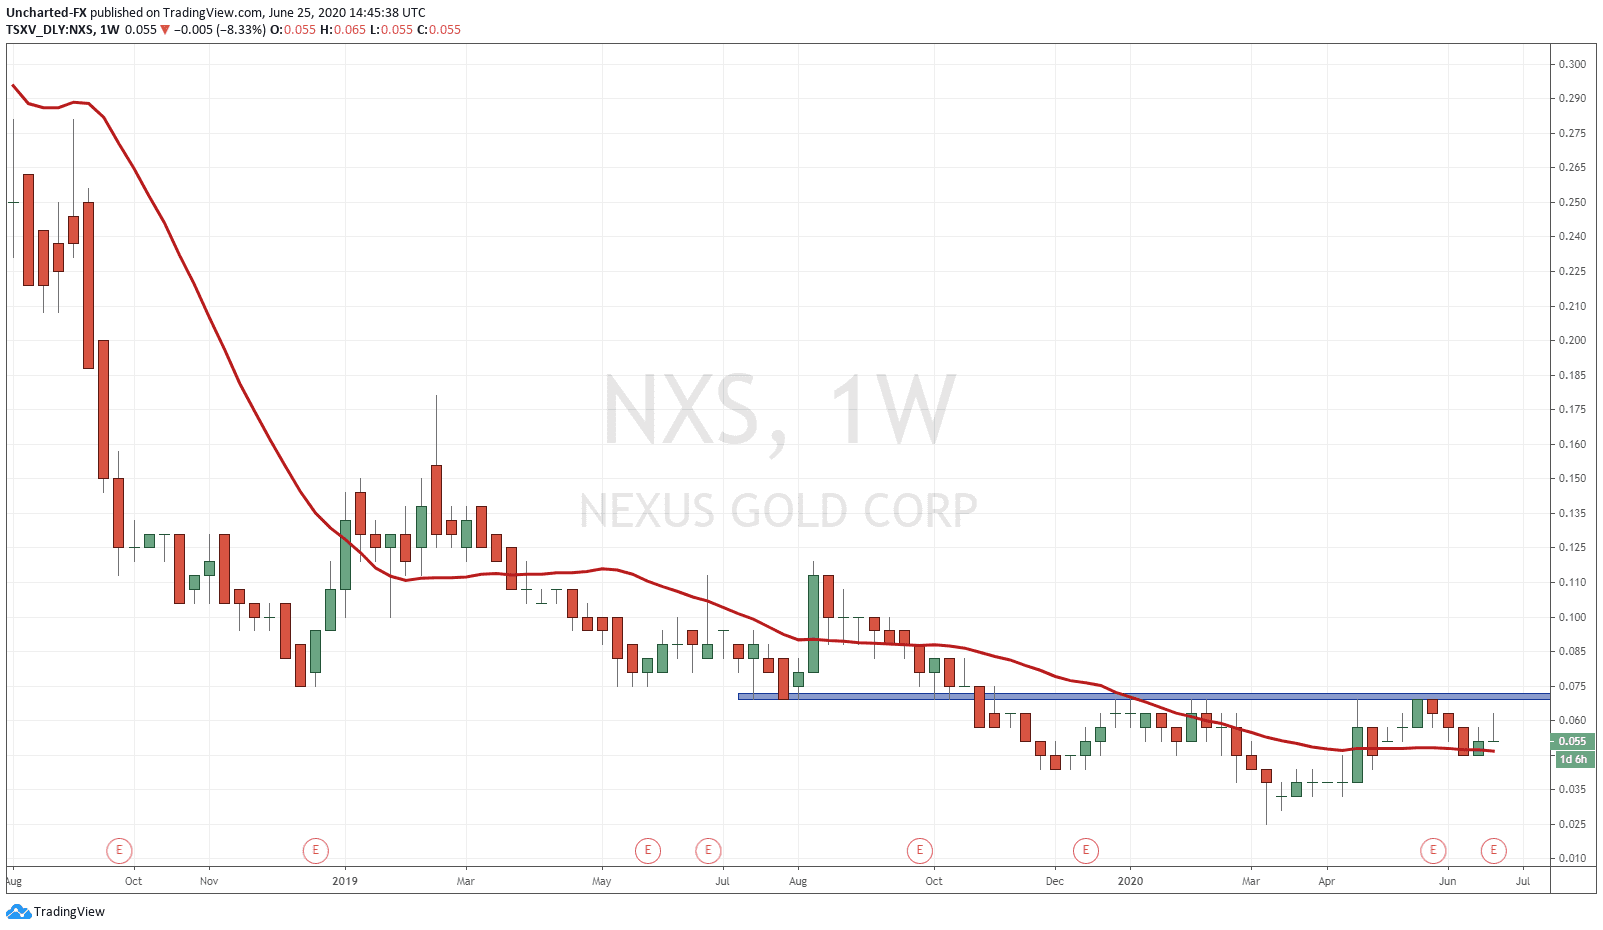
Zooming back, it is clear we were in a long downtrend, with multiple lower highs and lower lows. Recently, the lower high pattern has stopped and it seems as if the downtrend is exhausting. Another clue is the quintessential trend reversal pattern: the head and shoulders pattern. In this case, the inverse head and shoulders pattern since those appear when we see a shift from a downtrend to an uptrend.
That is all the inverse head and shoulders shows, a shift from one trend to another. In market structure this is seen from the transition of lower highs to higher lows. The neckline of the head and shoulders also coincide with a major flip zone (an area that has been both support and resistance). This zone is 0.070. To see a confirmation of the inverse head and shoulders, we require a break and close above this zone for an entry. This is so we confirm the higher low, by creating a higher high.
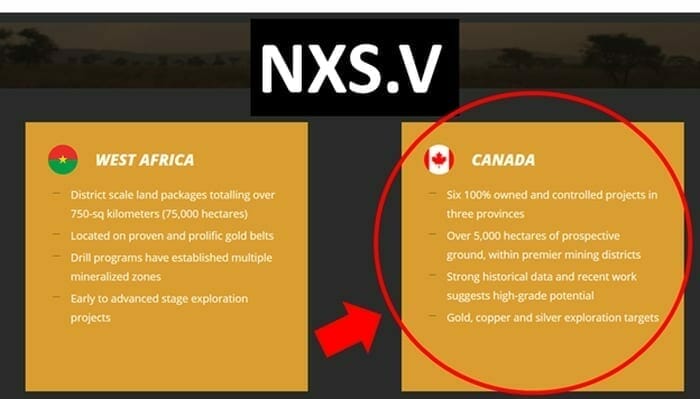
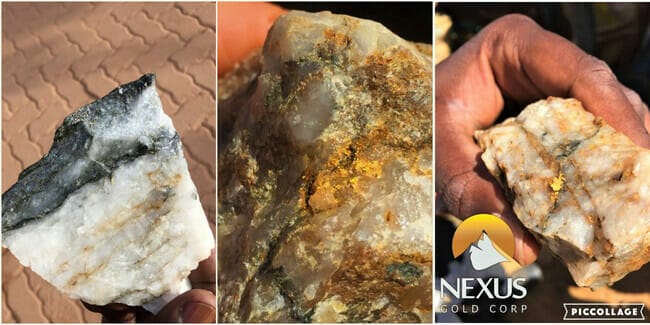
Nexus Gold is a Gold exploration and development company with assets in West Africa (Burkina Faso) and Canada. They have commenced drilling at their Mackenzie project in Ontario, and just yesterday, put out 10.5 g/t samples from Burkina Faso.
I am more of a technical guy, but if the fundamentals are sound, you can take an early entry. Our team here at Equity Guru have done a great job covering the fundamentals and I highly recommend checking them out here. Here is an article that deals with the Geology and opportunity. This is an opportunity where both the technicals and the fundamentals line up in a macro environment which is positive for Gold. I have predicted a mania in the junior miners akin to the alt coins when Bitcoin hit near 20,000. This could be beginning now but I think the mania will be more apparent once Gold does break out into all time new highs against the US Dollar. Everyone will be talking about it. Best to position yourself now.
Trade ideas and market discussion can be found on our Public Discord Channel: https://discord.gg/akcgCVP
Check out and subscribe to our Youtube channel where charts and market events are discussed on our Morning Market Moment show: https://www.youtube.com/channel/UCG7ZYDUeNANJiDxH88F9aQA