

Trade ideas and market discussion can be found on our Public Discord Channel: https://discord.gg/akcgCVP
Sometimes it pays to be a contrarian, and it certainly did for me. Over on the discord channel, I have been speaking about the contrarian long oil trade. Yes, I did acknowledge that on May 19th, when June futures expire there is the possibility of another 0 to negative oil price if the storage situation is not solved. With economies re-opening, it will aid in alleviating this storage issue however the supply glut will continue to build. The fundamentals for oil do not look so good, hence why this was a trade.
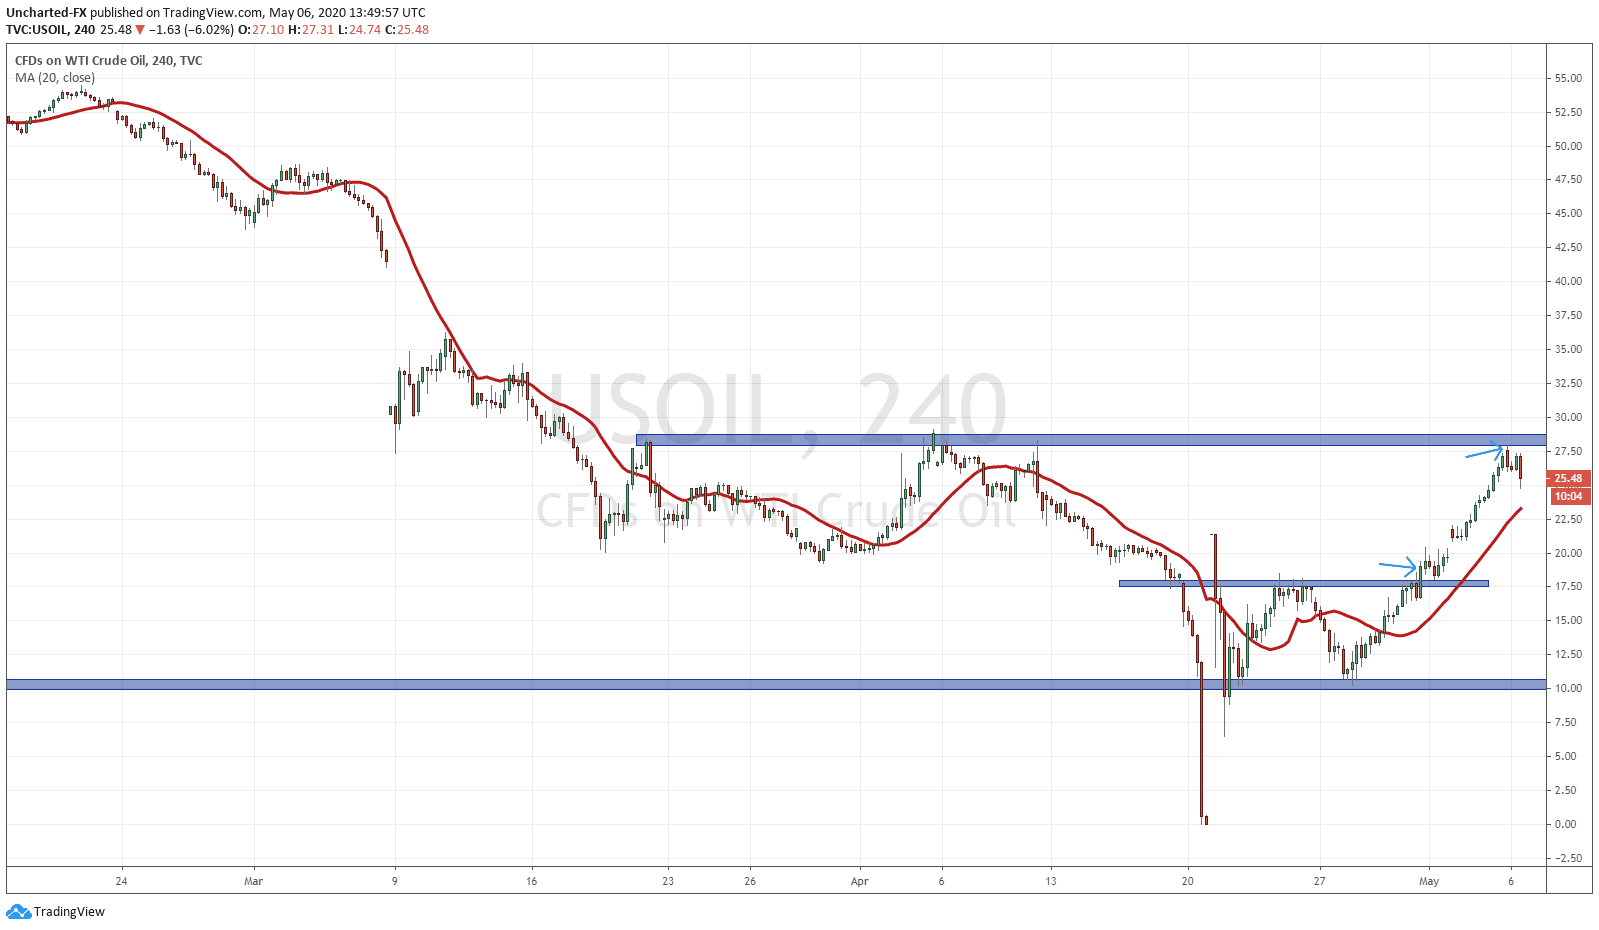
And what a trade it was. Just applying basic market structure, all markets move in three ways: an uptrend, a range, and a downtrend. Markets do not move down or up forever, they generally pullback to give off some steam before continuing the move in the dominant trend. We call these points swings (higher lows for an uptrend, lower highs for a downtrend). Generally, we should expect at least two swings in the trend before considering a possibility in the reversal of the trend. As you can see on oil, we had more than two swings to the downside. The downtrend is very obvious. So much so that we hit 0 and negative.
When we saw price bounce off of the 10.20 zone, it was telling. Instead of continuing the downtrend, we managed to show a potential bottoming. What we were looking for was a pattern. I mentioned over on Discord, that we could be setting up for a double bottom pattern here. We met the requirements: after a prolonged downtrend, and price not making new lows at a support zone. We then just had to wait for the trigger to enter. We were also looking at the energy ETFs, XLE, and XEG, as well as Marathon Oil (MRO), all of which broke out of their patterns and still have the potential to make another higher low.
Our trigger to enter oil came on the break on April 30th/2020. I have an arrow pointing to that break out and I want to emphasize the strength of that break. Look at the body of the candle. This is what we want to see with breaks above or below major zones. It needs to be strong with a large body. If price had reversed right away after this strong break, it would have been very telling. That would have been a fake out move and we would have continued our downtrend move.
Sunday’s opening had a gap up for oil, and I increased my position when we broke into new highs on Monday. So how did I come up with the take profit level? Very easy. We look for flip zones, an area that has been BOTH support AND resistance in the past. These areas are like magnets, attracting price to them before a potential reversal. In the case of oil, this happened quite quickly. In fact yesterday, we hit our take profit level to the T.
Took our profits on this oil run yesterday, and from here, I do expect a pullback move. However, I may be persuaded to enter oil long once again… more on this as the chart I am looking at develops.