

Trade ideas and market discussion can be found on our Public Discord Channel: https://discord.gg/akcgCVP
Check out and subscribe to our Youtube channel where charts and market events are discussed on our Morning Market Moment show: https://www.youtube.com/channel/UCG7ZYDUeNANJiDxH88F9aQA
It has been quite the week already, with equity markets breaking out from the resistance zones that we have been watching and last night, formed a higher low swing (or a confirmation of the retest where previous resistance now becomes support), and now are pulling back to retest that breakout zone. Markets are looking past the US-China tensions and second wave of covid cases and are focusing more on economies reopening and the US economy getting back on track. Although…it is quite probable that we will hear the announcement of sanctions being imposed on Chinese officials by the end of this week, a US counter on the National Security Law to be signed for Hong Kong. Some say the Chinese are retaliating by announcing the devaluation of the Yuan at its weakest levels ever. More on that tomorrow, but over on the discord chat, we are watching it for sure.
Other than that, we are expecting central banks to keep these markets propped with all their programs. Just today, the European Central Bank announced a 750 Billion Euro stimulus program, finally finding a compromise with European members that were against more stimulus…but it turns out to be a different case when Germany goes into recession, definitely fueling the conspiracy theorists when they say it is Germany which runs the EU and the ECB.
So yes, markets are currently falling, but they are still holding the market structure for now. Currently, this is just a pullback until we get a break below the resistance now turned support zone. I wanted to take a look at some airline stocks here. We have been following the charts of the banks, the cruise ships and the airlines since this all began. Spoke about how all these charts were displaying a bottoming pattern. These patterns are about to be tested, and some have already broken above these patterns, signifying a buy signal. It is important to point out that even with the dismal earnings, these stocks did not continue to sell off further below the consolidation zone. Very important because it signals that perhaps ALL the bad news for these stocks have already been priced in. This is where some of the value investors may step in if the set up is conducive to their macro views, or are banking on a recovery.
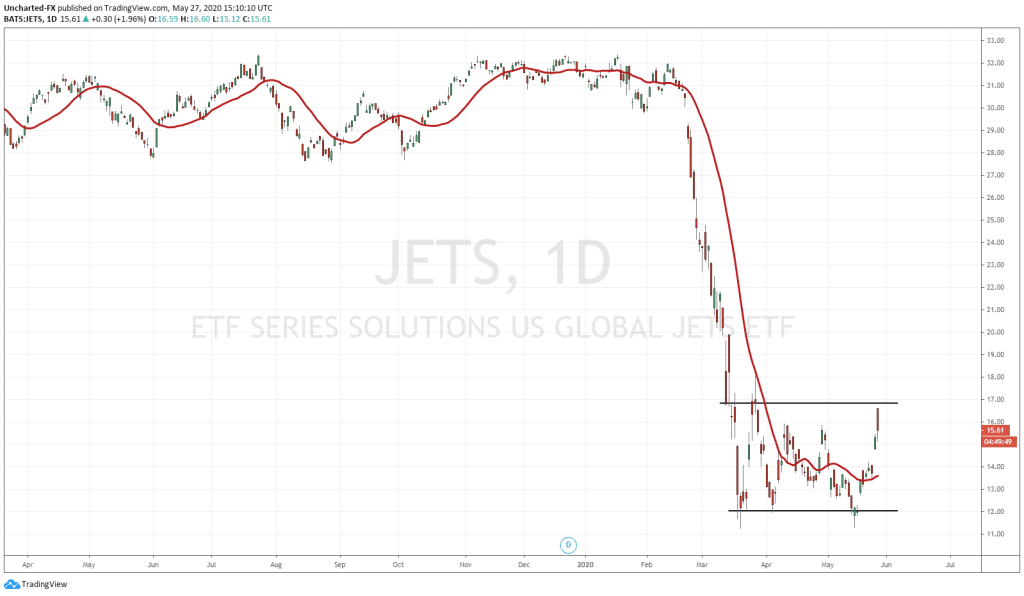
First up is the ETF for the airlines, aptly named JETS (pictured above). This is a chart we have covered on Market Moment before. The consolidation here is apparent now. A nice downtrend with price stalling at 12.00. This is the line in the sand for now as price could not close below. The resistance in this consolidation or range I am watching is the 17.00 zone. Nice whole numbers. How did I come with 17.00? Easy, change your chart into a line chart, and you can find these support and resistance levels much easier. It is a simple, yet powerful trading tool. If you do, you will see there is a flip zone (an area that has been both support and resistance) at 17.00. A trade like this is never triggered until we break above the range. For all we know, price could continue to range and head back down to 12.00. I am not a range trader, I prefer playing the break out of the range in either direction. What I would like to see here is a break and close above 17.00 here on the daily chart. And the candle close would have to be significant.
There are a few specific stocks that have broken their consolidation patterns, and are now in lay for us.
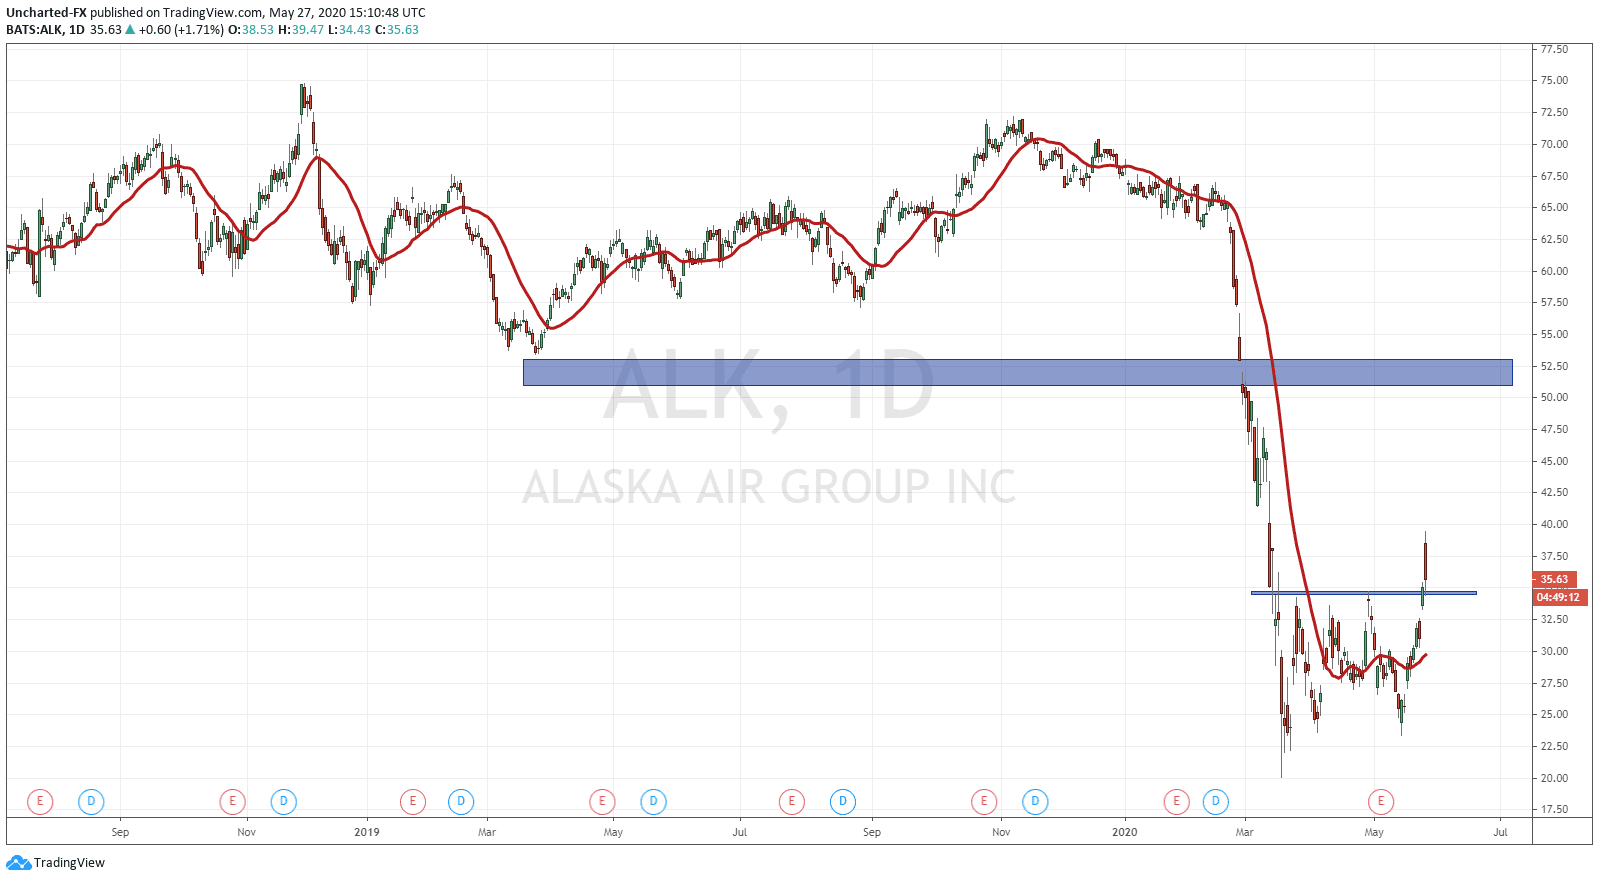
First of all is Alaska Air Group (ALK). Very nice consolidation after an extended down trend. You can also see the area where price is bottoming. These are my favourite types of charts. Yesterday’s daily close was significant as it closed above 34.50, the resistance zone we were watching. Today, price actually gapped up and opened higher, but has now retraced with this market sell off. All normal for now as long as the equity indices hold the support zones. As a trader, one could enter here for a nice risk to reward ratio. But the true entry depends on the successful retest of this break out zone. We actually get that once we beak and close above recent highs at 39.44, giving us the higher low to work with. We should expect this uptrend to continue, with more higher lows as we move up to around the 50 dollar zone.
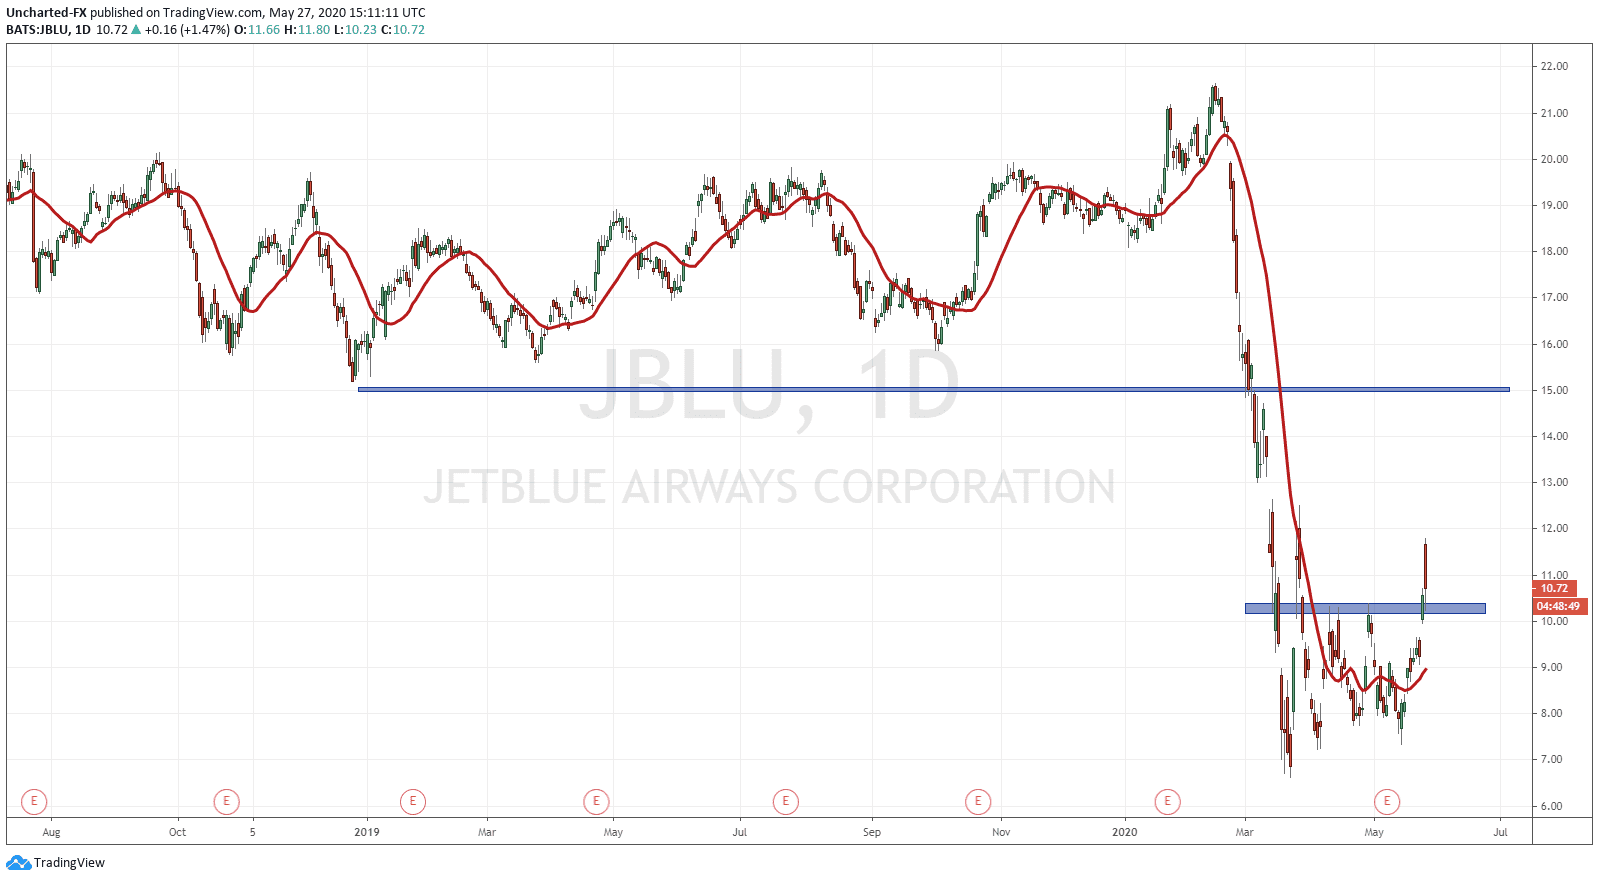
Jet Blue (JBLU) is the other darling over on our Discord Channel. One of our members favourite long term investing plays. Well, the chart here looks great. Market structure is similar to that of Alaska. A nice prolonged downtrend with multiple lower highs. Price then began bottoming at 7.00, developing a range and no more new lower highs. Once again, earnings came in dismal, but price did not react indicating all the bad news is already priced in. We had the break out above 10, and now are currently retesting that zone as equities pull back. Same set up and I like it. The same rules for entry apply as indicated above with Alaska.
So in summary, the charts look good and indicate nice market structure. Quite frankly, they display beautiful examples of market structure. We are retesting the previous break out zone and an entry here now provides great risk vs reward. This is a play that looks to eventual recovery and one where it seems all the bad news has already been priced in.