
Trade ideas and market discussion can be found on our Public Discord Channel: https://discord.gg/akcgCVP
Check out and subscribe to our Youtube channel where charts and market events are discussed on our Morning Market Moment show: https://www.youtube.com/channel/UCG7ZYDUeNANJiDxH88F9aQA
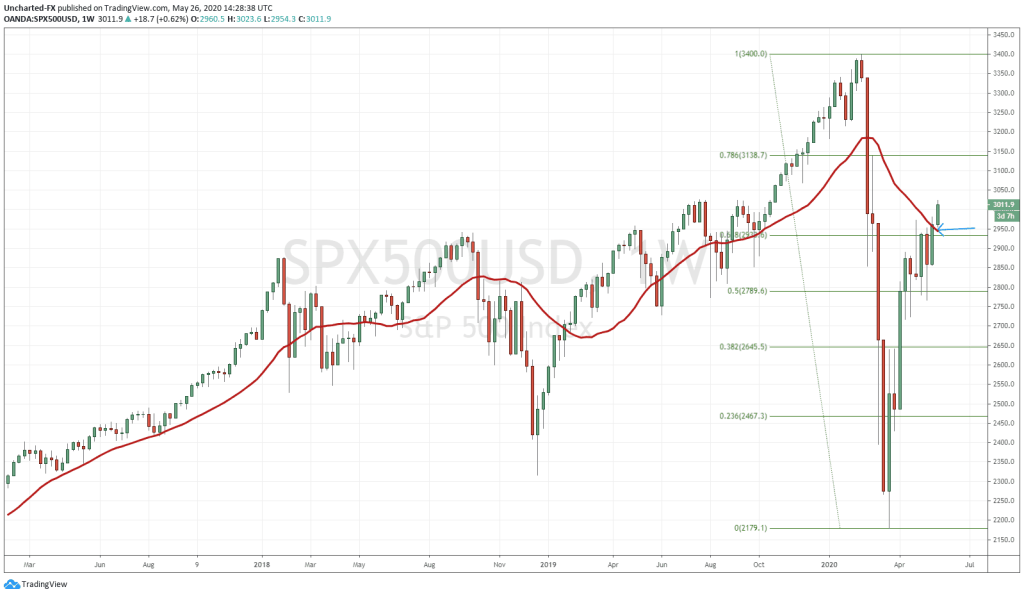
I promised yesterday that I would do a follow up on a very significant break on the S&P. An area we have been watching since the markets began to tumble and then recover back in late March. An area that has seen five weeks of price action tests before finally achieving a breakthrough. I am of course talking about the very important 61.8 fibonacci level.
Our discord followers have seen me post the weekly chart of the S&P, the Nasdaq, and the Dow every Friday to keep our members updated on this number. Fibonacci is a tool used by traders which provides zones where price could be expected to pull back to before continuing the trend. In this case, we were looking for a pullback before continuing the move lower in the markets, thereby confirming a bear market. I say could, because it really depends on the candle signal and how price reacts at these levels, the 38.2, 50.0, and 61.8 being those key levels.
If the move is very strong, we should expect the price to pullback to just the 38.2 before moving lower. This indicates that bears and sellers were eager to pile in. This was what I was expecting originally when markets fell. The move down was crazy, and judging by the size of the red weekly candle closes, this move was indeed strong. But as you can see from the chart, price did find a reaction at the 38.2 fibonacci, but no signal was produced afterwards. For us, it is about the candle that forms AFTER the test of the fibonacci, so patience is key. You can also see by looking at the chart that the 50 fib and of course, the 61.8 fib also produced levels of reaction. This is what we were expecting, and why fibonacci is powerful. It is used by many traders/investors who do not want to chase price moves, but want to wait for price to pullback before continuing. Remember, markets never move up or down in a straight line, they move in waves, where price pullbacks and makes a swing before continuing the dominant trend.
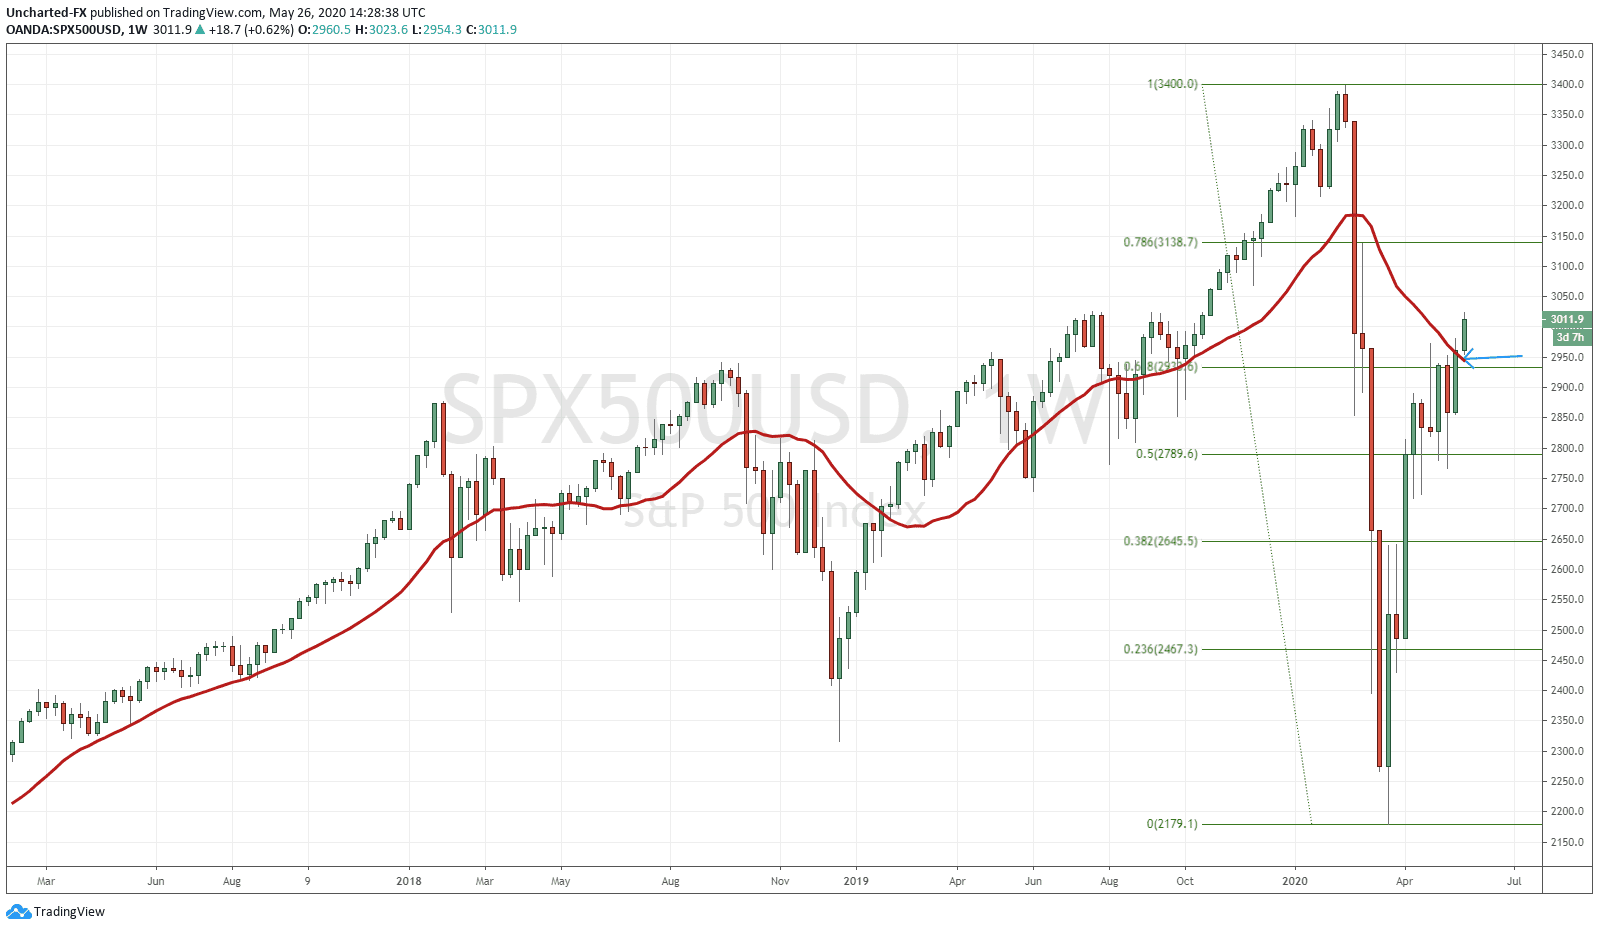
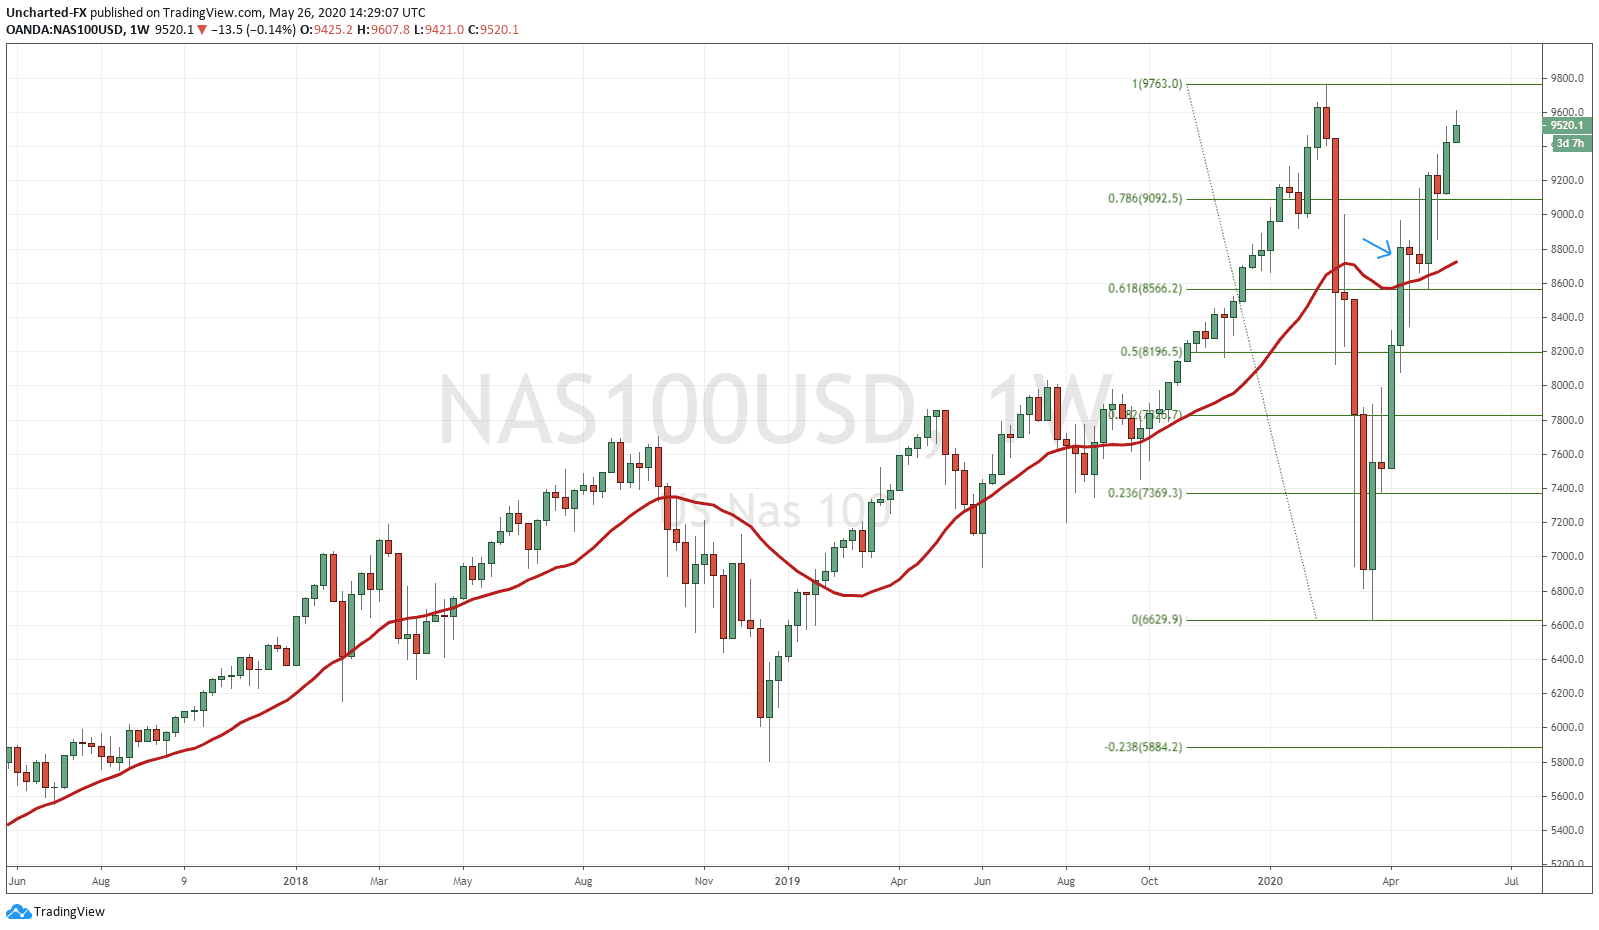
Two weeks ago, I did talk about how the S&P 500 weekly candle did break above the 61.8 fib, but just barely. This was not a clean and strong break that I wanted, and let members of the discord channel know that I was waiting for the following weekly candle close. As you can see, it was a red sell off. The break we had last week was much stronger. I like it. Just for comparison, take a look at the Nasdaq weekly chart and how strong the break was. Look what has happened afterwards… we are getting closer to previous record all time highs.
As crazy as it sounds, this break above the 61.8 means that markets are more likely to make all time new highs, than they are to make new lows. It is very likely that the bottom is already in. Can something still cause markets to drop? Of course. In my post regarding markets and their next move, I spoke about how a black swan event is what is required now for the recent lows and new lows to be tested. This can come in plenty of ways: US-China spat or action, food supply crisis, maybe a second more deadlier wave of covid, a bank failure or major corporate bankruptcy, or what I am personally watching for, some drama in the upcoming 2020 US elections. I do think these elections will get violent. Regardless of whatever political party wins, the opposite side will not accept the results. People will protest and harm one another on the streets. The US is very divided and this division continues even as people argue about what party would have handled covid better.
The financial media is saying markets are higher due to hopes of a vaccine. I think most of us are smarter than that. Been saying it for some time, and it has been covered in my posts in the past, markets are going up because they are the only place to go for yield. Period. Central banks have lowered rates and have printed much more money. Bonds cannot be used for real yield, that is the return minus the rate of inflation minus taxes. Using real returns, all bonds are pretty much negative now. They are being bought and held rather for capital appreciation, betting on lower interest rates and more cuts, and they are being bought up because of the asset allocation model that many managers adhere to. This will change as managers realize it makes no sense to hold bonds. Do I expect to still see money running into bonds? Yes, because if the market is pricing in negative interest rates, it means there is a trade to be made in bonds for capital appreciation.
Speaking about negative interest rates…this is the key. Markets are pricing them in. With more debt and more government debt, negative interest rates seems like the next step. The Fed following the precedent set by the European Central Bank, the Bank of Japan, and the Swiss National Bank. This is going to be bullish for US equity markets. Not only will we see domestic purchasers of US stocks, but I have been arguing for some time that there will be a rush of foreign money into the US equity markets, which is why they will outperform many other world markets.
So far the follow through on the markets after the 61.8 break has been strong. While US markets were closed for Memorial Day, the futures moved higher and broke previous recent high levels. Very bullish. Going forward, I expect to see a slight pullback perhaps today and/or tomorrow before markets continue this move. The 61.8 level remains key. If we see another weekly candle close above it, the move to the upside and eventually new all time highs look much more probable.