Trade ideas and market discussion can be found on our Public Discord Channel: https://discord.gg/akcgCVP
Check out and subscribe to our Youtube channel where charts and market events are discussed on our Morning Market Moment show: https://www.youtube.com/channel/UCG7ZYDUeNANJiDxH88F9aQA
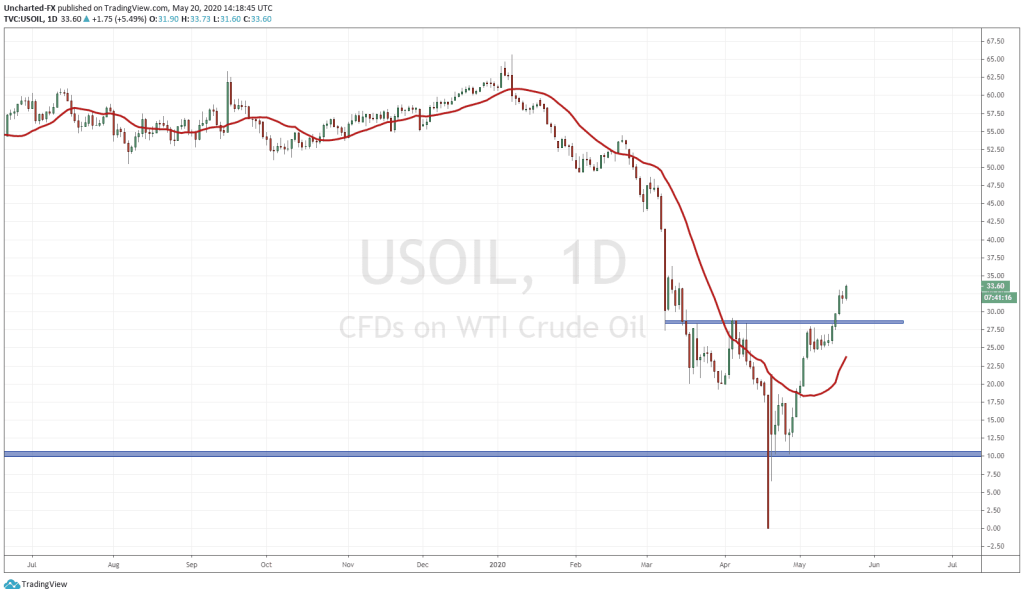
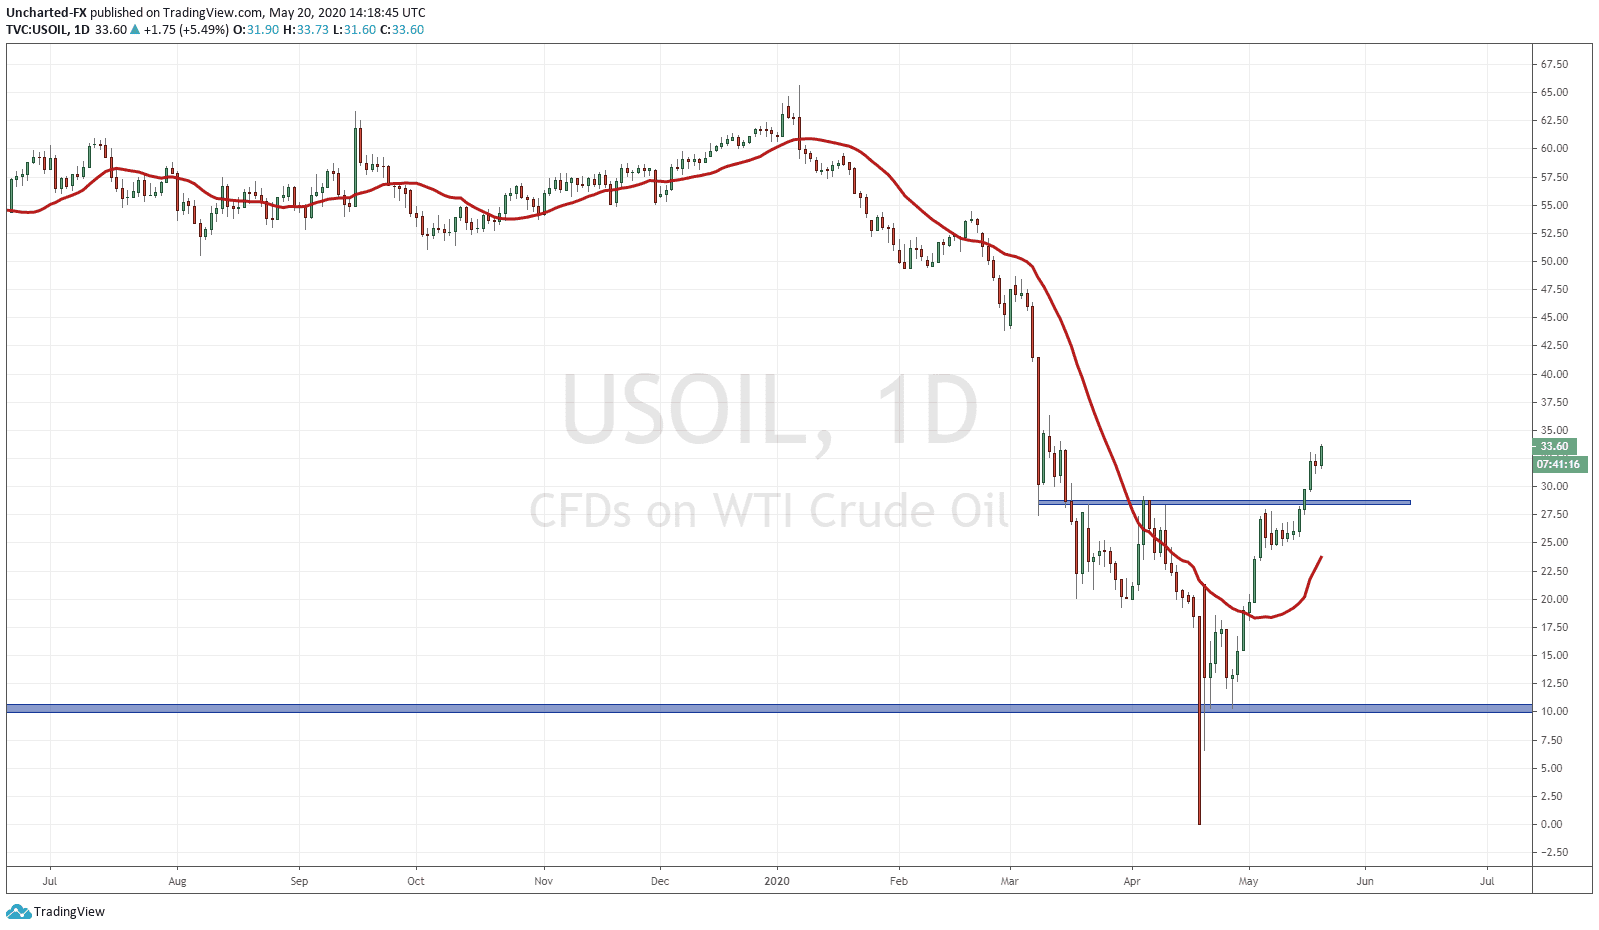
A few weeks back, I teased another oil set up, after we ripped the face off of oil on the 4 hour chart. We were long oil on the break of above 17.95, confirming a double bottom pattern, and we took our profits at around the 28.00 zone. A good target as it was a major resistance/flip zone which attracts price like a magnet.
From then, I have been scoping the daily chart of oil for another reversal pattern to play out…and it has. The quintessential reversal pattern, the head and shoulders pattern, or in the case of a downtrend, an inverse head and shoulders pattern. It looks just as it sounds. We have two shoulders on either side, and then price action protruding higher/lower in between, making the shape of a head between two shoulders. This pattern displays a shift in a trend. From a downtrend to an uptrend in the case of oil. The level we were watching for a break above was the 28.60 zone. Not only did this confirm the pattern, but it also is the lower high on the downtrend. According to simple market structure, a downtrend is continuing as long as we remain below the current lower high. With the lower high taken out, we can say the downtrend is over.
To be honest, ideally I would have liked price to test that 28.60 zone as we did, and then retreated a bit deeper to form the right shoulder. We did indeed retreat but not as much as I would have liked. Oil was quite strong and resilient. But that’s trading. Patterns and price action rarely are textbook examples. We trade the market we have and see, not the markets we want and hope to see. This is a very important rule for traders and investors.
So where to now? We have our higher low at 24.60 and are in an uptrend as long as this level is held. There has been no pullback yet to make a new higher low, so that is due and will occur at some point. Nothing moves up or down in a straight line during a trend, they form swings which we call higher lows and lower highs. Usually, price can retreat back to the breakout zone (28.70 for oil) and this creates a retest that traders look for to determine whether the move will continue with momentum. But as mentioned before, oil has been quite strong and resilient. I am keeping my eye on two targets here, the first one is upcoming at the 35-36 zone, I want to see how price reacts there, and then the second target would be closer to 40 dollars.
Another lesson here is to be careful of media information. The media has been very bearish on oil but more particularly, on a repeat of another negative oil price futures contract. A repeat of the oil-mageddon. Well, May 19th, the date when June contracts and delivery was settled, has come and gone and we did NOT get a repeat.
As I have mentioned in my posts here on Market Moment, storage facilities could be faring better as economies begin re-opening. Where I live, traffic is now back to normal. Businesses are opening up, and people are heading to work. Things are moving again. If we were to see a spike in covid cases once again, and we get another lockdown for a month or so, then yes, obviously storage capacity will be jeopardized and we would get a repeat of oil-mageddon.
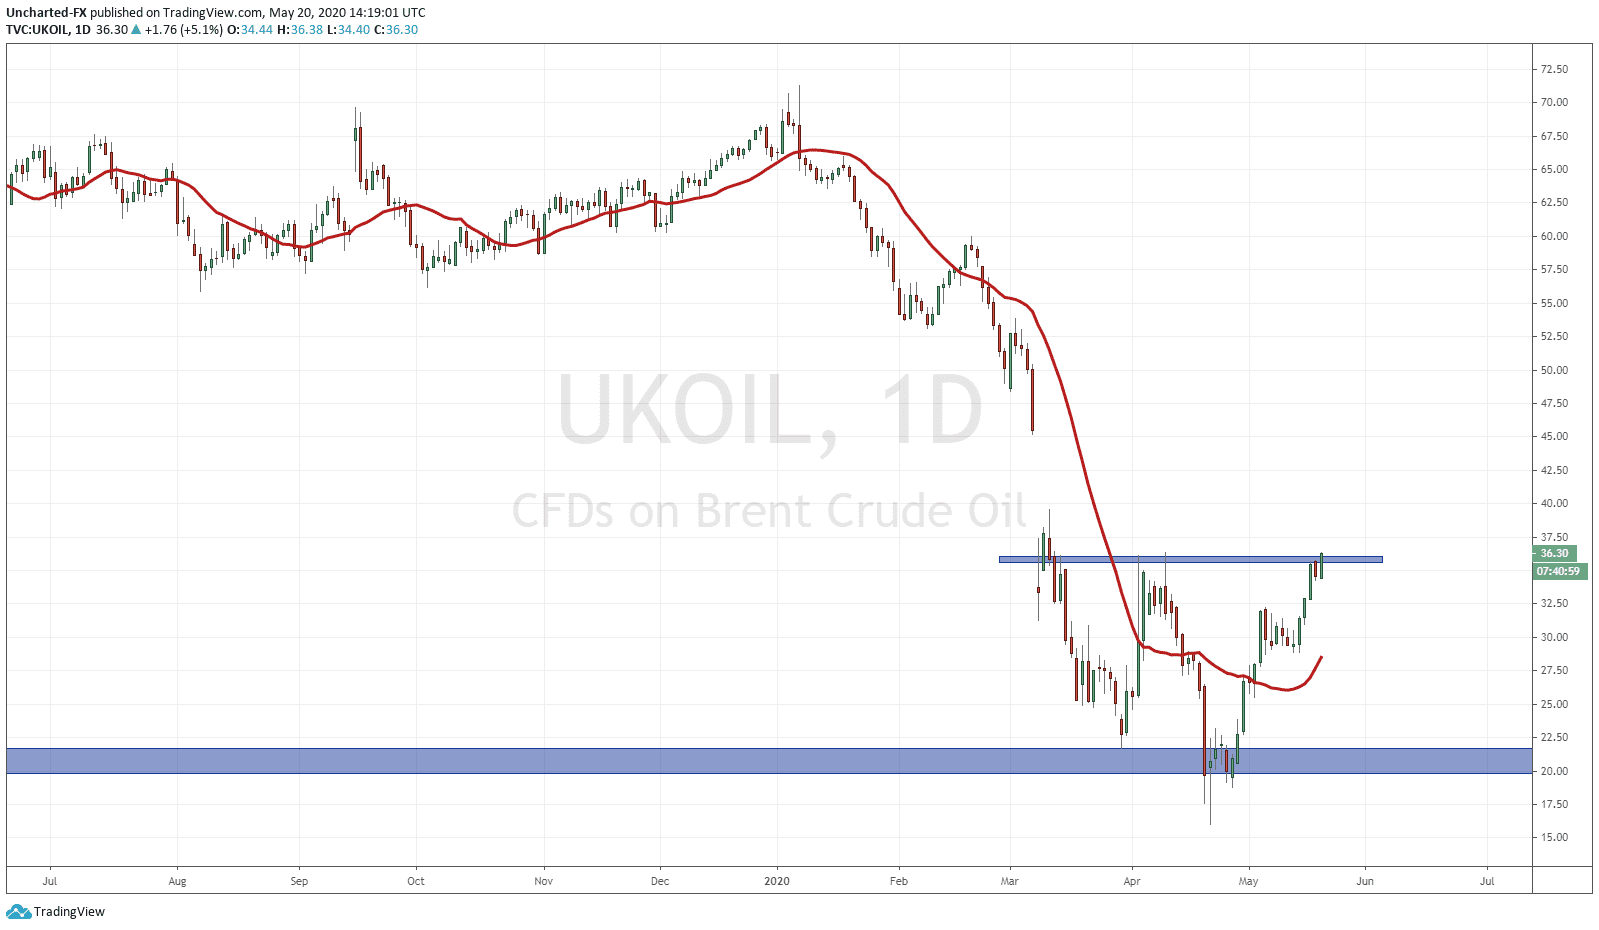
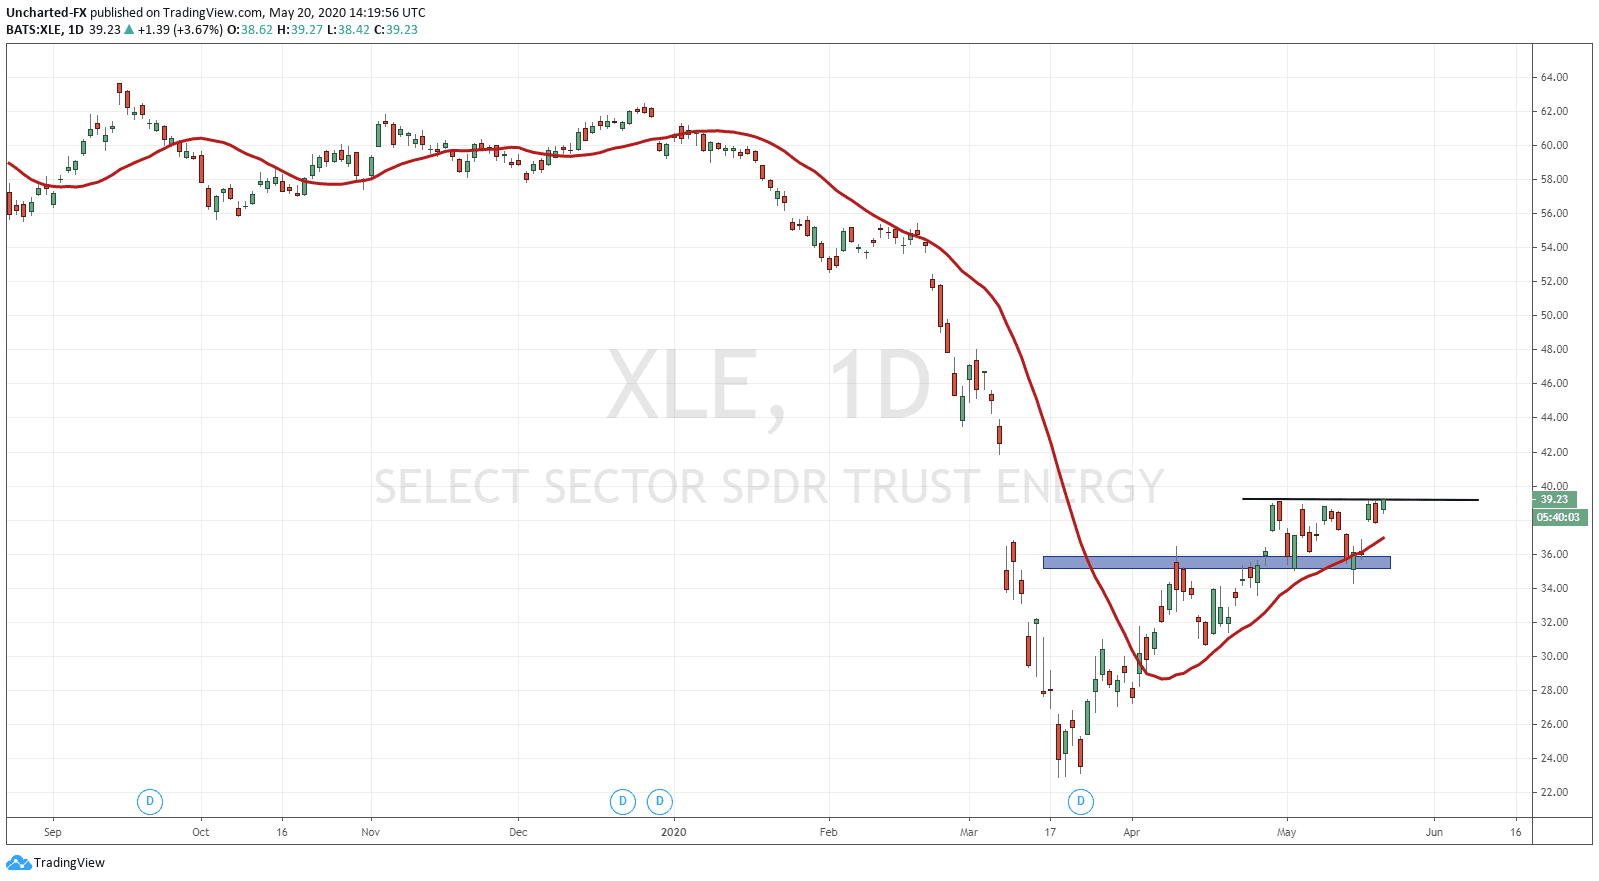
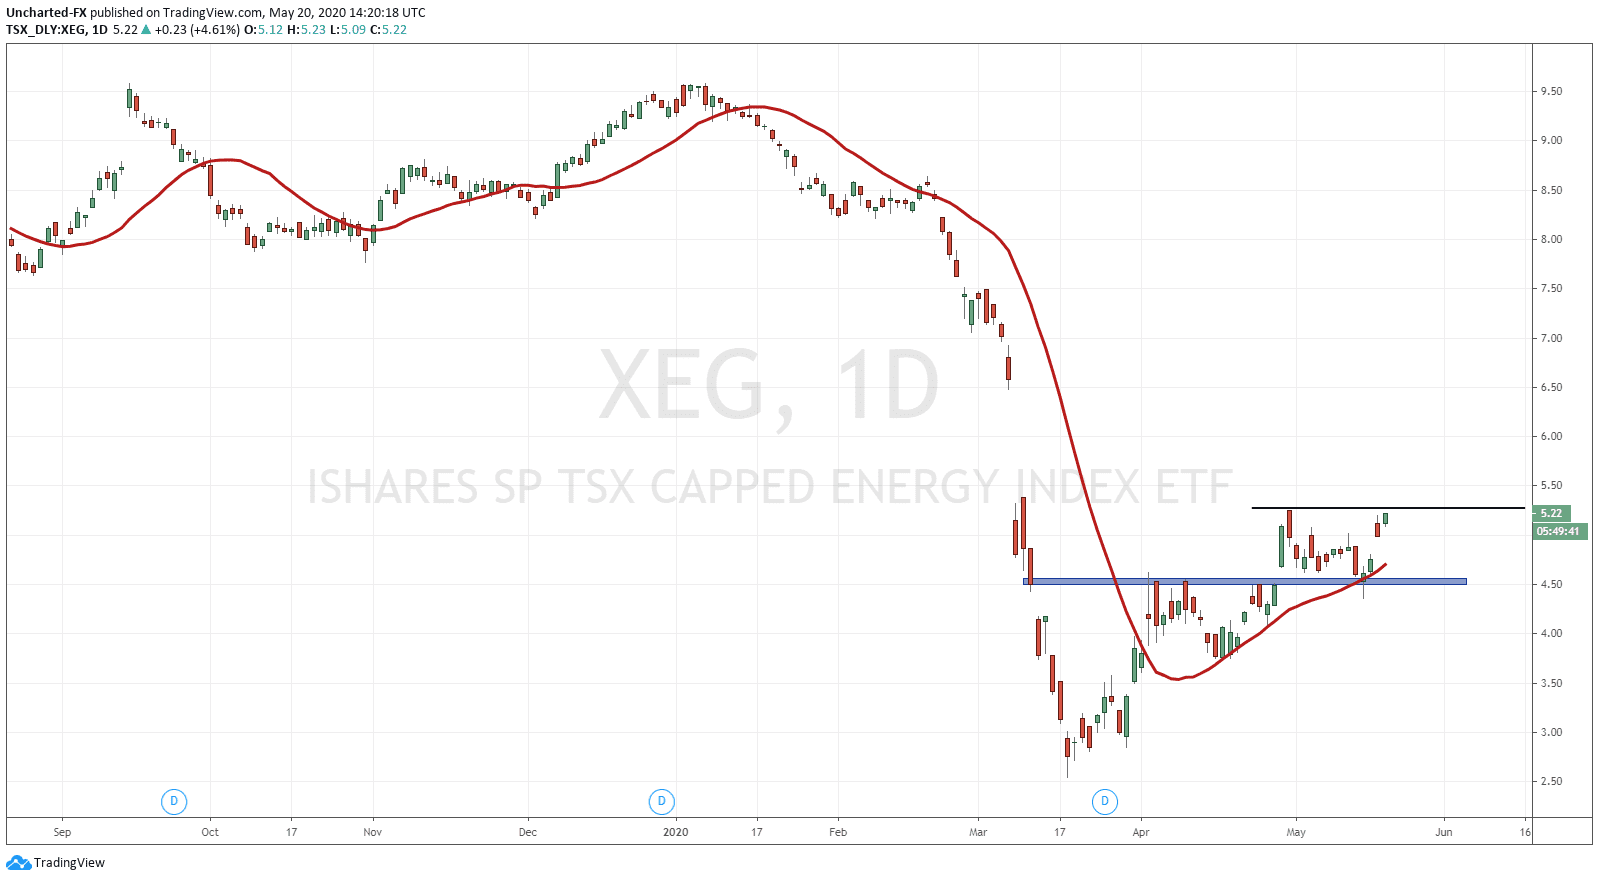
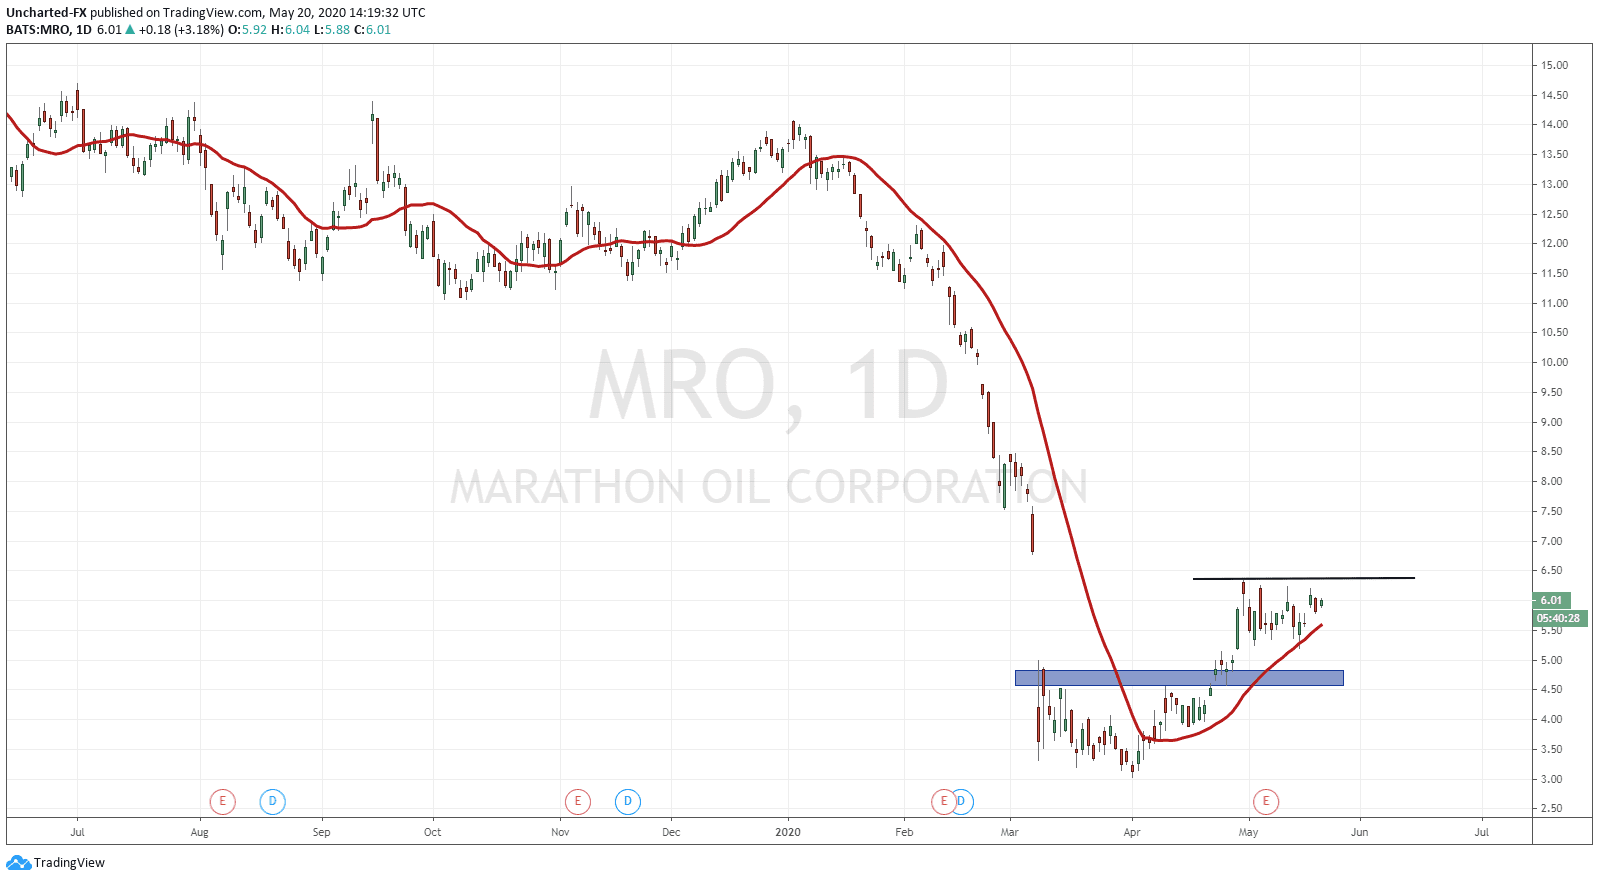
In summary, the oil head and shoulders pattern is looking good. This is a trade I personally have taken on Sunday evening, and am still holding onto. We do have the EIA crude oil stock change coming up which impacts oil. This data print on oil reserves comes out every wednesday. Depending on the data print, we could get our pullback…or not. Just assess the charts as the news and data is digested. A few other charts I want to end off with are those of UKOIL (Brent) which is catching up and is creating a similar reversal pattern on the daily chart. Also the charts of XEG, XLE and MRO, three charts we have covered on the Equity Guru discord channel, and members were alerted on the breakout. You can see that price did retest the breakout zone in the case of XLE and XEG, and so far we have held and are in the process of forming a second higher low once we break above previous highs.