

Trade ideas and market discussion can be found on our Public Discord Channel: https://discord.gg/akcgCVP
Equity markets have been on a tear upwards lately, with many still saying this is a dead cat bounce and new lows are still expected. In summary, they are saying we have not yet bottomed. On our discord channel, and many previous Market Moment posts, I have talked about the weekly chart, and the major fibonacci levels which show us where a reversal COULD occur. I emphasize ‘could’ because we have had reactions at fibonacci levels, but we still need a confirmation on this retest. With the weekly chart down below, we did at one time test the 38.2 fibonacci, and this week, we have tested the 50 fibonacci level. Remember, as long as we remain below the 61.8 fibonacci level there remains a possibility that we will move lower and make new lower lows. This is just market structure and how markets move. They do not go down or up in a straight line, but move down in waves. Price moved in the dominant trend (down) and then retraces or pullbacks, before continuing lower.

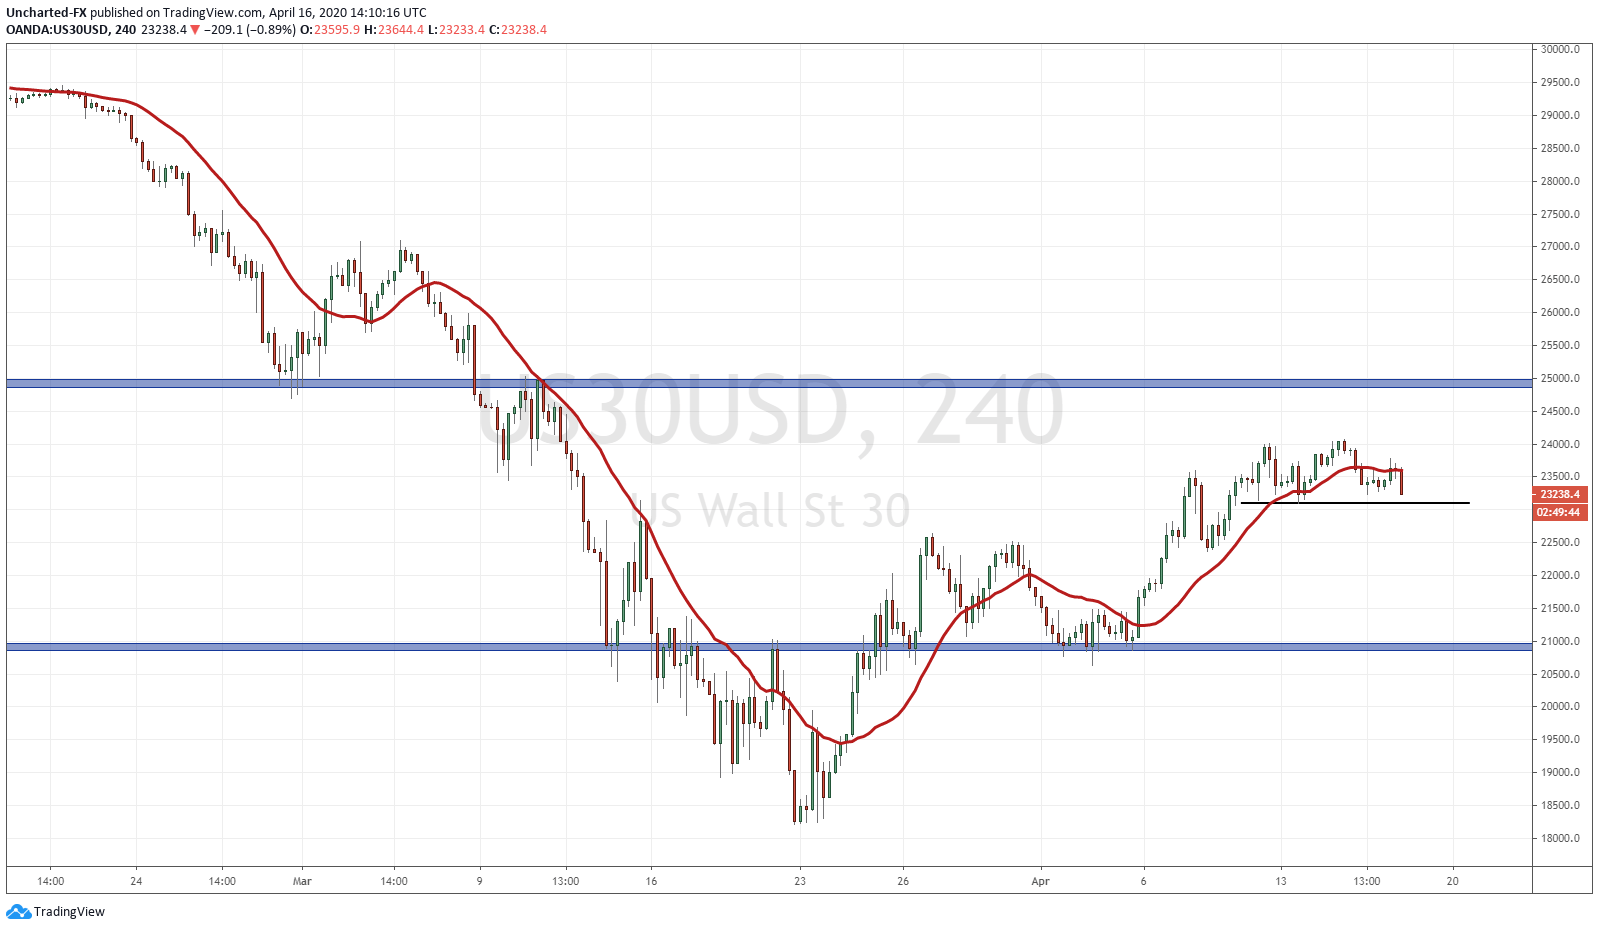
We are currently watching the 4 hour charts closely. All the US major indices are showing signs of perhaps a trend exhaustion and a possible reversal. Ready to roll over? We cannot say for sure until certain criteria are met. Before we discuss that, it is important to note that the Nasdaq is still diverging from the other indices. This is largely due to the moves in tech stocks…especially the fact that Amazon continues to make new all time highs.
Back to the 4 hour charts. As mentioned above, we are getting signs of what appears to be an exhaustion. You can see that prices are not continuing to make new highs, but instead, price began to taper off and roll over. With a well trained eye, many people can see the very famous reversal pattern, the head and shoulders. This pattern looks just as it sounds. You create two shoulders on the left and the right, and in the middle we have a head protruding above. In technical terms, this shows us that a trend may be shifting. In this case, we had higher lows and higher highs, perhaps now shifting to lower highs and lower lows. We are watching the 23100 zone. Why? This is the previous higher low we are working with. As long as price remains this level, we are still in an uptrend. If we do not break below, we can very well move higher or just range. For the short sellers: remember we need a break and confirmed candle CLOSE below here.
On the fundamental side, we continue to see the disconnect between the financial markets and the real economy. Although many would argue all the bad data has already been priced in which would mean we have already bottomed. The Jobless claims came out at 5.25 million today. We have now erased all job gains since the 2008 great financial crisis. On the positive side, 5.25 makes it appear the job loss trajectory is down. The peak of 6.9 million has not been eclipsed, and we have put out lower loss data since then (6.6 and now 5.25). Have we seen the peak in lay offs and is the worst over? It seems now that bad news is good news for the financial markets (the return of the Stonks meme is already occurring on popular meme social media pages). Time will tell. As of now, I will be watching the 23100 zone on the Dow.