
Trade ideas and market discussion can be found on our Public Discord Channel: https://discord.gg/akcgCVP
Over on the discord chat, our trade ideas have been on fire. With the equities, with bitcoin, and now it seems with oil. To be clear, I am not touching the oil CFD’s or futures. Just too volatile with moves sometimes over 20% a day in either direction. The physical will still have problems come May 19th, when the June delivery is settled. Very likely to see another negative oil price as the supply glut and no storage capacity continues. There is some hope though. If economies re-open, or if some nation *cough China cough* uses this time and low prices to increase their strategic reserves, it can aid in removing oil from supply and reducing the supply glut. Again, there is some hope, although this chance of hope is relatively slim. Images and reports of oil tankers left at sea and awaiting to dock to unload their oil have been broadcast around the world. They are pretty epic.
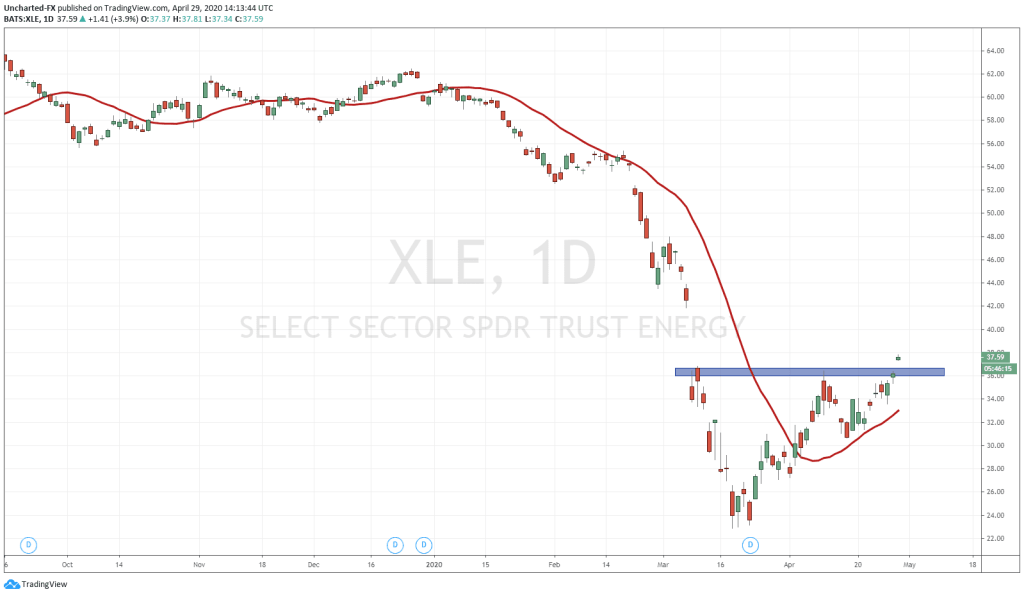
We have not been talking about trading oil over on the discord channel. Instead, we looked for chart plays that showed a bottoming pattern. There were a few great looking charts. The first one I want to talk about is the XLE. We have been watching the cup and handle pattern, but more importantly, waiting for the resistance zone to break to trigger the cup and handle. Today, we got a large pop higher in XLE, and it appears as if we will get our daily candle close by the end of today’s session. Just a very nice chart. A nice prolonged downtrend, which then showed trend exhaustion (not making new lows) and finally the confirmation of some sort of reversal pattern. Our traders sniped this. Now we will see if this gap will be filled up to 42. To view what companies are in the XLE, click here. Chevron and Exxon Mobil make up the largest holdings.
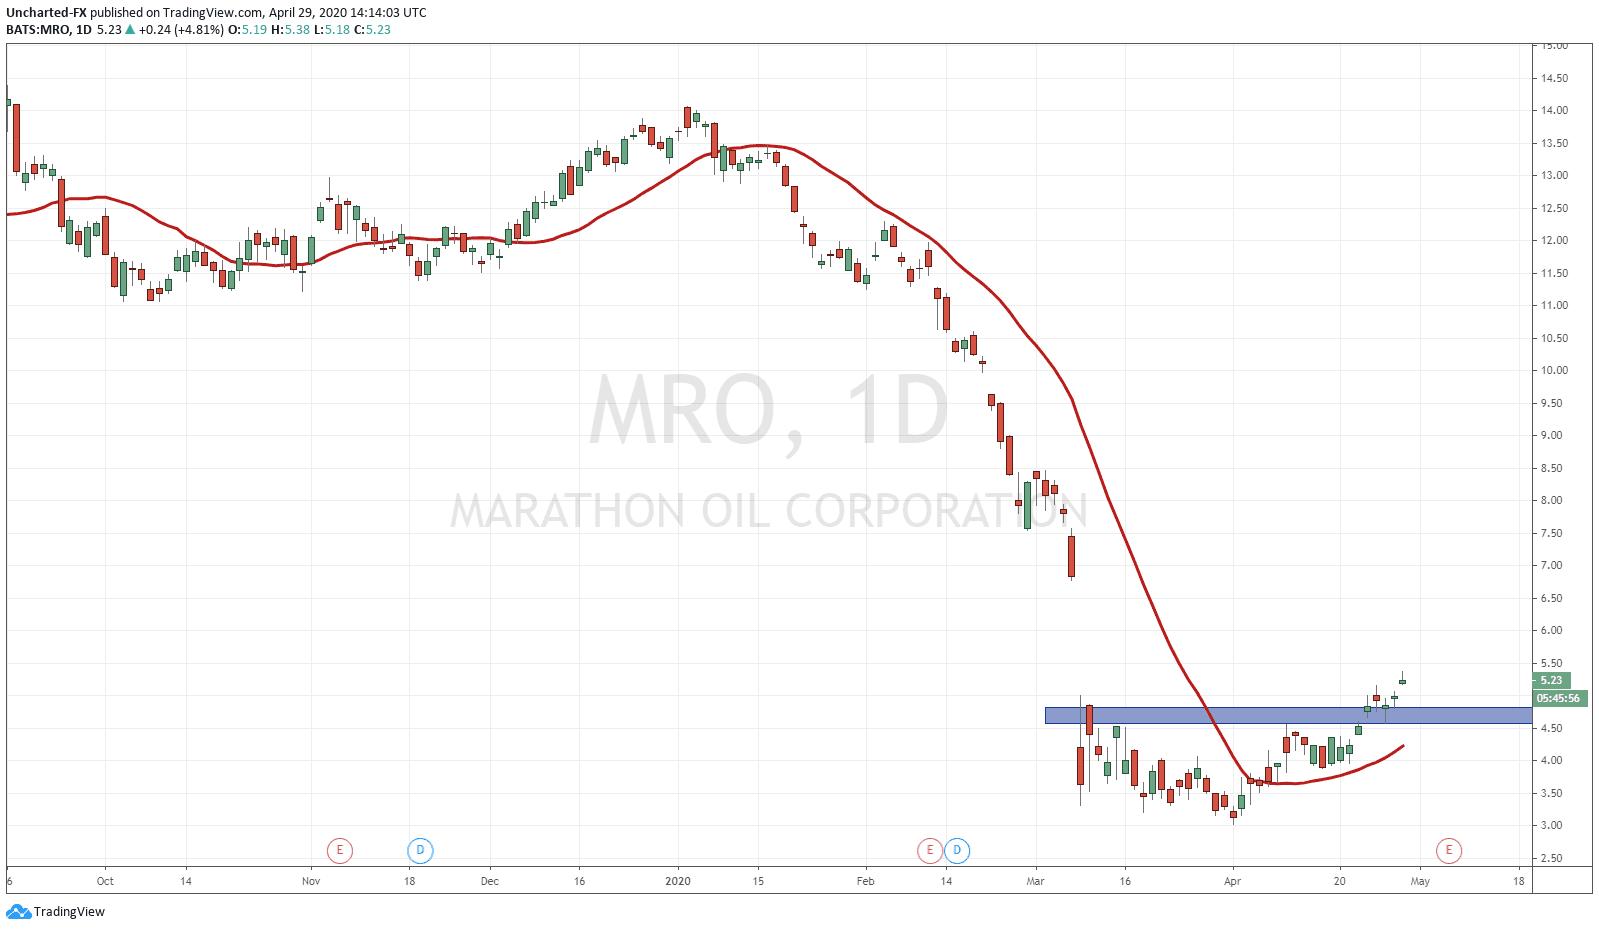
Another chart we have been watching was that of Marathon Oil (MRO). A very similar chart pattern. This pattern is more advanced because you can see we broke above the resistance zone to confirm the cup and handle, and then we retraced to retest the break out zone, and now we are set to close higher. This validates the retest of the break (which is normal price action), and will also give us our first higher low swing to work with on the break. Remember, just plain market structure: as long as price remains above that swing level, we are still in that trend. This is also a potential gap filler.
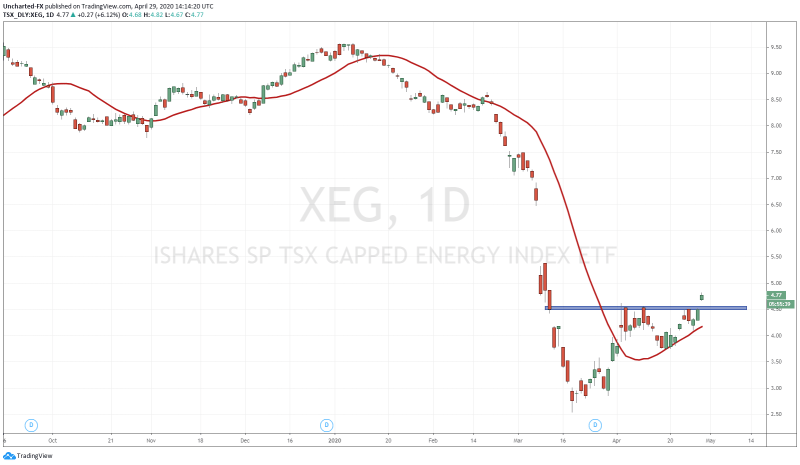
Finally, for those playing in Canada and the TSX, take a look at XEG. It is the ETF for energy and the composition can be found here. Suncor and Canadian Energy make up the largest composition. The chart itself looks similar to XLE, and the same pattern may play out. We will be watching for the break and close of today’s daily candle. So far so good with oil over 18%, helping us gain momentum over this level.
Yes, these plays were and are contrarian. But I believe one needs to be a contrarian to make money. If what financial media and mainstream media told you was true, then everyone would be rich. Successful investors and traders have done the opposite. The old adage of buy when everyone is selling or when there is blood on the streets. Keep in mind this is a trade idea. I would start closing positions near May 19th if we have not hit our targets, because there is potential for oil to drop even lower if supply and real economy fundamentals do not alleviate. So far, the chart looks great, and market structure is just the way markets tend to move.