
Trade ideas and market discussion can be found on our Public Discord Channel: https://discord.gg/akcgCVP
The agricultural markets have made quite the moves. In a market where forex/currency are somewhat dead, and equities maintained a range on the long term chart, the agricultural charts are showing some exciting price action as we go forward. These markets are not traded very often by many, but I do recommend keeping an eye on them. On the market side, brokers generally provide great margin on agricultural contracts. This means you can buy more contracts and see bigger returns with how they move. Of course there is a danger to this if you do not know what you are doing, but there is risk for every trade and investment you make that you need to account for and handle. We do this with our risk vs reward ratio being at minimum 1:2.
For those that do not follow these markets, Corn is the most traded followed by wheat and finally soybeans. Soybeans being in the news (and on traders computers) more consistently this past year with the US China trade deal talks, and how China promised to buy more agriculture goods from America. Soybeans being a big component of this, and US soybean farmers complaining and requiring bailouts when the Chinese said they would just get their soybeans elsewhere such as Brazil. Are foodstuff still important in this new covid-19 world?
Food is always important, and many of us take for granted the fact that store shelves will always be stocked. However, there is more and more news now of supply chains for food being disrupted. A lot of migrant workers could not farm, and this slow down in the economy (the oil crash exacerbated this) has prevented regular shipping cycles. There has been a lot of food that has been left to rot because they cannot be shipped away. Just today, news came out that even food banks across America are now running out of food.
Now I would not be worried about staples such as bread, milk, cheese or eggs since most of those are produced domestically in most nations. Unless we see those farms shut down, we should expect a continuous supply. The longer this lock down goes, the worse it will be for supply chains and the global economy. On the positive side, we are seeing some economies beginning to open up. Mostly in Europe, with Germany opening this past Monday mainly due to the fact that Berlin and Bremen and other municipalities were on the verge of bankruptcy. Some US states are set to open on May 1st, and others when they meet President Trump’s guidelines. The decision is in the hands of the governors.
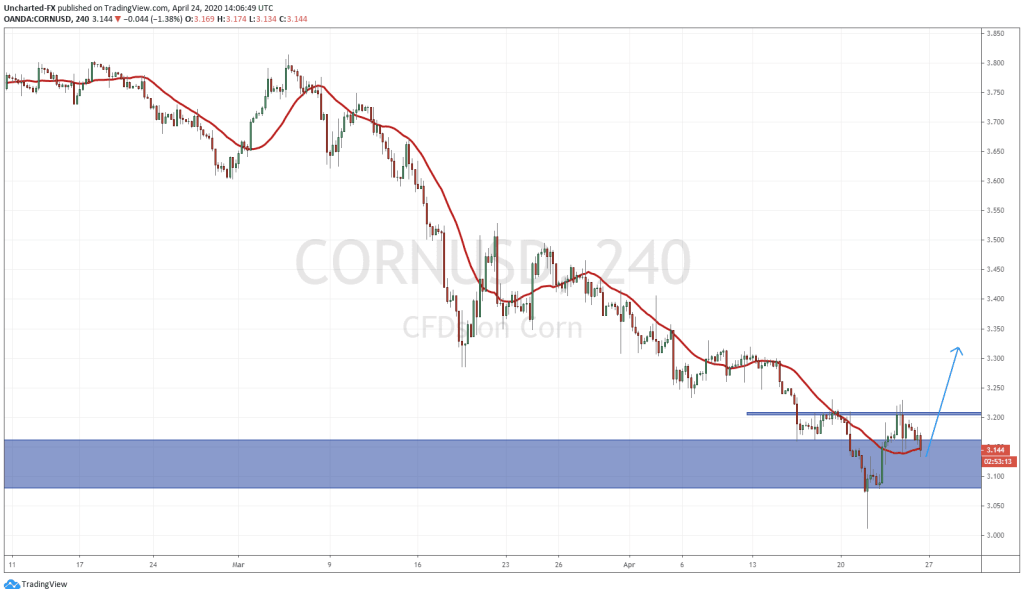
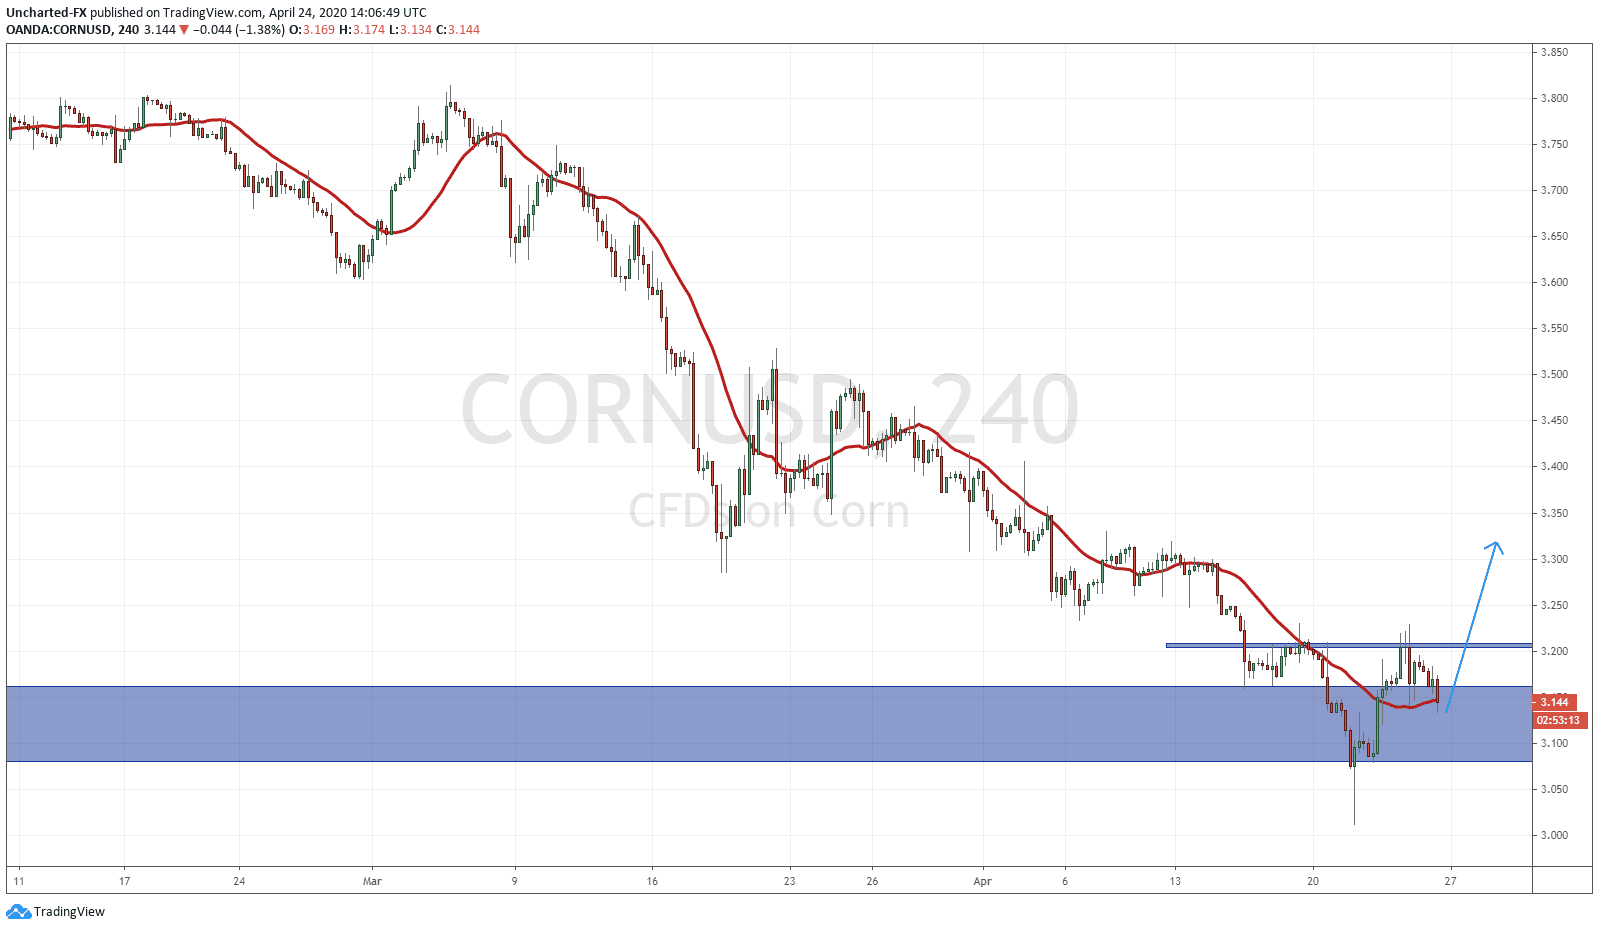
On the technical side, there is a lot of excitement to look forward to on corn. A lot of confluences here pointing to a move higher. First of all, we are at a major support zone, indicated by the big blue zone I have. If you zoom out on the daily or weekly chart, you will see how important this zone is. We tested this support zone in 2004, 2007, 2008, 2009, 2014 and then 2016 and it held. A very important zone indeed. The way markets tend to move, is that when a trend is in motion, they are attracted to these major zones like a magnet, and once reached, is where a reversal is more likely.
Look how price reacted in the zone. We had a textbook fake out candle pattern. You can see that from the candle closest to the bottom of the chart. We had a huge wick that indicated buyers stepped in and drove price up. Once again, this is why we await candle closes before entering. Many news traders saw this as a red candle and thought the sky was falling. They ended up chasing and then got trapped as price reversed. This is common, and is great to hit the stop losses of newbie traders.
Finally, we have the pattern we look for when we search for reversals. The head and shoulders pattern. Well, it has not formed yet, but we will be watching for this next week. This pattern simply shows us the transition from one trend to another. You can see on the chart, the blue arrow would create and confirm our fight shoulder in this reversal pattern. We want to see a close above the 3.20 zone to confirm the trigger of this pattern. It also would break above the previous lower high (at the same 3.20 area to the left) which officially ends the down trend. Exciting chart indeed and I do hope you traders keep your eyes on the agriculture markets from time to time.