

You know I was hoping to enjoy this weekend off from charts, but I could not help myself. Many traders, even just for curiosity, had their eyes glued on the bitcoin chart given the Israel-Iran tensions over the weekend.
Before the markets closed for the weekend, they did sink as the Iranians said they were going to retaliate after Israel hit the Iranian embassy in Syria. Markets sold off, we saw oil initially rise before selling off, and then gold do the exact same. The US Dollar was the winner.
The Iranian attack came over the weekend, and because bitcoin and cryptos are open 24/7, I could not help but see how bitcoin would react. Both bitcoin and gold are seen as assets money runs into for safety when things are getting ‘spicy’. When there is real fear. One can argue that the run up in both assets was frontrunning geopolitical tensions, but we did not see these assets perform on the news. As I said just a few sentences ago, the US Dollar was the real fear trade winner.
So how did Bitcoin react to the Iranian attack?

Above is the 5 minute chart. Can you guess when news of the Iranian attack on Israel came out? Yup, bitcoin dumped from $67,200 to $60,800 in the span of 30 minutes. A major sell off with crypto traders calling it a major crash.
From an intraday perspective, $67,200 is a major ‘supply’ zone since it saw a huge sell off.

In early Monday trading, bitcoin did attempt to approach this zone but fell… and has printed a nice looking intraday head and shoulders pattern.
So is this geopolitical news going to cause bitcoin to sell off hard as the US Dollar rises?
I trade the markets I see and not the markets I want to see. I see a potential bearish pattern trigger, but before we look at the chart, let’s look at some bullish news. Trust me, this will be important in determining if buyers will step in to defend support.
There are two major bullish catalysts today:
First, we have news that Hong Kong has given conditional approvals for asset managers to start spot-bitcoin and ether ETFs. This would boost the crypto markets as it opens up to more institutional money.
The second catalyst has to do with the upcoming bitcoin halving event in late April. This will slash new supply, and if bitcoin demand remains high, supply and demand laws support higher bitcoin prices. Some crypto bulls even see a longer term target of $450,000 over the next year.
Keep these in mind as we look at the daily chart below.

My readers and followers know I am a market structure technical trader and investor. Following simple market structure has provided me and my readers some nice and major wins.
Market structure is just how all markets move. Simply put, all markets move in uptrends, downtrends, and range-consolidation.
Bitcoin is clearly in an uptrend with higher lows and higher highs. According to market structure, the uptrend remains intact as long as price remains above the current higher low. Bitcoin actually tested the current higher low this weekend. The price drop on the Iran news actually hit the higher low… and buyers stepped in to defend this zone. The higher low comes in at the $61,200 zone.
This is your major support if you are a bitcoin bull.
But some are focusing on the resistance up at the $74,000 zone. A zone where bitcoin bears have stepped in twice. This is important given the fact bitcoin is now displaying a range/consolidation phase. This phase tends to be the end of an uptrend (and the end of a downtrend when reversed!). The chance of reversal increases with the addition of a reversal pattern. Many are now on watch for a double top pattern.
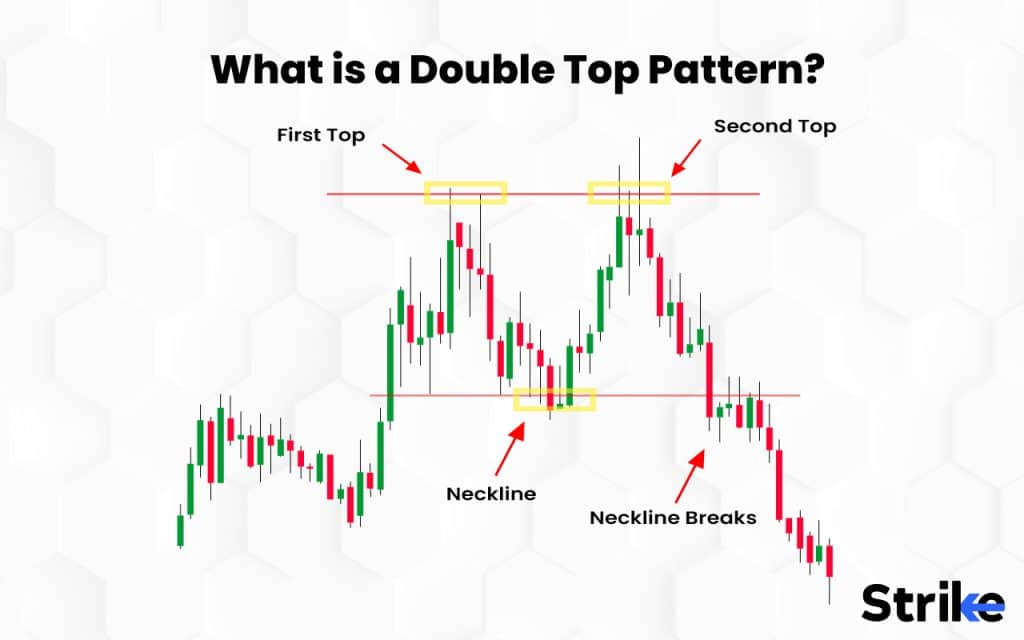
You can see the skeleton of this reversal pattern forming.
BUT there is still one major factor. These reversal patterns aren’t just triggered with the appearance of the pattern. Sure, some traders and investors may front run the trigger, but more astute traders wait for the breakdown of support (or neckline) for the confirmed trigger.
This means bitcoin would need to break and close below the support, which also coincides with the current higher low, at $61,200. Basically a strong red candle body breakdown below the blue support zone I have drawn taking out the lower candle wicks.
A breakdown below could see bitcoin pullback to $50,000.
Once again, the bearish pattern is ONLY triggered with a breakdown. Technically, the uptrend remains intact and bitcoin can take out recent highs around $74,000… or continue to range.

For the bulls, I would watch for a strong candle close above the lower high on the 4 hour chart around $68,500.
Note the large wick candle even on the 4 hour at our major support/neckline zone.
Bitcoin bulls should also watch the price action of the US Dollar.

The Dollar looks bullish and there is some resistance at 107 which is likely to be tested.
Happy Trading.